Food Lion 2011 Annual Report Download - page 27
Download and view the complete annual report
Please find page 27 of the 2011 Food Lion annual report below. You can navigate through the pages in the report by either clicking on the pages listed below, or by using the keyword search tool below to find specific information within the annual report.-
 1
1 -
2
-
3
-
4
-
5
-
6
-
7
-
8
-
9
-
10
-
11
-
12
-
13
-
14
-
15
-
16
-
 17
17 -
 18
18 -
 19
19 -
 20
20 -
 21
21 -
 22
22 -
 23
23 -
 24
24 -
 25
25 -
 26
26 -
 27
27 -
 28
28 -
 29
29 -
 30
30 -
 31
31 -
 32
32 -
 33
33 -
 34
34 -
 35
35 -
 36
36 -
 37
37 -
38
-
39
-
40
-
41
-
42
-
43
-
44
-
45
-
46
-
47
-
48
-
49
-
50
-
51
-
52
-
53
-
54
-
55
-
56
-
57
-
58
-
59
-
60
-
61
-
62
-
63
-
64
-
65
-
66
-
67
-
68
-
69
-
70
-
71
-
72
-
73
-
74
-
75
-
76
-
77
-
78
-
79
-
80
-
81
-
82
-
83
-
84
-
85
-
86
-
87
-
88
-
89
-
90
-
91
-
92
-
93
-
94
-
95
-
96
-
97
-
98
-
99
-
100
-
101
-
102
-
103
-
104
-
105
-
106
-
107
-
108
-
109
-
110
-
111
-
112
-
113
-
114
-
115
-
116
-
117
-
118
-
119
-
120
-
121
-
122
-
123
-
124
-
125
-
126
-
127
-
128
-
129
-
130
-
131
-
132
-
133
-
134
-
135
-
136
-
137
-
138
-
139
-
140
-
141
-
142
-
143
-
144
-
145
-
146
-
147
-
148
-
149
-
150
-
151
-
152
-
153
-
154
-
155
-
156
-
157
-
158
-
159
-
160
-
161
-
162
-
163
-
164
-
165
-
166
-
167
-
168
 |
 |
decreased from EUR 821 million to
EUR 631 million mainly as a result of
lower operating profit. In 2011, income
taxes amounted to EUR 156 million,
compared to EUR 245 million in 2010.
The effective tax rate decreased to
24.7% (29.8% in 2010), mainly as a
result of the lower weight of our U.S.
operations due to the recorded impair-
ment charges.
Net profit from continuing operations
decreased by 17.5% and amounted to
EUR 475 million, mainly due to impair-
ment charges, or EUR 4.72 basic per
share (EUR 5.74 in 2010).
Group share in net profit amounted to
EUR 475 million, a decrease of 17.4% at
actual exchange rates (-14.9% at identi-
cal exchange rates) compared to 2010,
mainly due to the impairment charge.
Per share, basic net profit was EUR 4.71
(EUR 5.73 in 2010) and diluted net profit
was EUR 4.68 (EUR 5.68 in 2010).
Cash Flow Statement
In 2011, net cash provided by operating
activities amounted to EUR 1 106 million;
a decrease of EUR 211 million compared
to 2010, a decrease by 16.0% at actual
rates (12.4% at identical rates) mainly as
a result of lower operating profit in 2011
and higher cash used in core working
capital, mainly due to reducing overdue
supplier balances at Maxi.
Net cash used in investing activities
increased by EUR 600 million, mainly
due to higher business acquisitions and
higher purchase of tangible and intan-
gible assets partly offset by cash pro-
vided by sale or maturity of debt secu-
rities. Business acquisitions amounted
to EUR 591 million and predominantly
related to the acquisition of Delta Maxi.
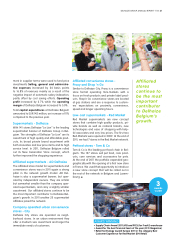
Capital expenditures amounted
to EUR 762 million, an increase of
EUR 102 million compared to 2010 as
a result of a more new stores opened,
including in Southeastern Europe fol-
lowing the acquisition of Maxi and the
start of the construction of a new auto-
mated distribution center in
Belgium.
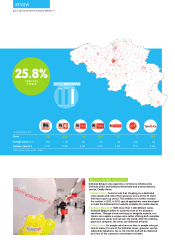
54.6% of total capital expendi-
tures were invested in the U.S. activi-
ties of the Group, 18.7% in the Belgian
operations, 24.2% in the Southeastern
Europe and Asia segment and 2.5% in
Corporate activities.
Investments in new store openings
amounted to EUR 231 million (30.3% of
total capital expenditures), an increase
of 18% compared to EUR 196 mil-
lion in 2010. Delhaize Group invested
EUR 185 million (24.3% of capital
expenditures) in store remodeling and
expansions (EUR 167 million in 2010).
In 2011, Delhaize Group remodeled or
expanded 66 supermarkets in the U.S.
and remodeled 23 supermarkets in Bel-
gium.
Capital spending in information tech-
nologies, logistics and distribution, and
miscellaneous categories amounted
to EUR 346 million (45.4% of total
capital expenditures), compared to
EUR 297 million in 2010.
Net cash used in financing activities
amounted to EUR 146 million, a decrease
of EUR 197 million compared to the prior
year mainly due to additional long-term
loans resulting from the issuance of a
EUR 400 million retail bond in October
2011 mainly used to repay Delta Maxi’s
long-term and short-term debt.
Balance Sheet
At the end of 2011, Delhaize Group’s
total assets amounted to EUR 12.2 bil-
lion, 12.3% higher than at the end of
2010, mainly as the result of the integra-
tion of the Delta Maxi operations.
At the end of 2011, Delhaize Group’s
sales network consisted of 3 408 stores,
an increase of 608 stores compared to
2010. Of these stores, 695 were owned
by the Company. Delhaize Group also
owned 12 warehousing facilities in the
U.S., 7 in Belgium and 14 in the South-
eastern Europe and Asia segment.
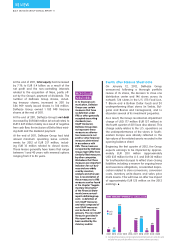
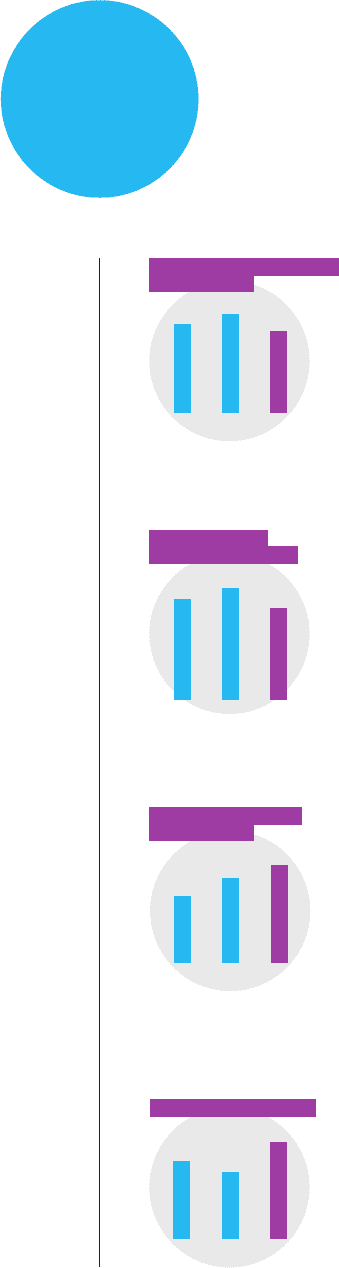
GROUP SHARE IN NET PROFIT
(in millions of EUR)
2009 2010 2011
475
574
514
BASIC NET PROFIT
(GROUP SHARE) (in EUR)
2009 2010 2011
4.71
5.73
5.16
CAPITAL EXPENDITURES
(in millions of EUR)
2009 2010 2011
762
660
520
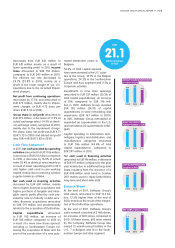
EUR
21.1
billion revenues
in 2011
2009 2010 2011
2.6
1.8
2.1
NET DEBT (in billiions of EUR)
DELHAIZE GROUP ANNUAL REPORT ‘11 // 25