Food Lion 2011 Annual Report Download - page 66
Download and view the complete annual report
Please find page 66 of the 2011 Food Lion annual report below. You can navigate through the pages in the report by either clicking on the pages listed below, or by using the keyword search tool below to find specific information within the annual report.-
 1
1 -
2
-
3
-
4
-
5
-
6
-
7
-
8
-
9
-
10
-
11
-
12
-
13
-
14
-
15
-
16
-
17
-
18
-
19
-
20
-
21
-
22
-
23
-
24
-
25
-
26
-
27
-
28
-
29
-
30
-
31
-
32
-
33
-
34
-
35
-
36
-
37
-
38
-
39
-
40
-
41
-
42
-
43
-
44
-
45
-
46
-
47
-
48
-
49
-
50
-
51
-
52
-
53
-
54
-
55
-
 56
56 -
 57
57 -
 58
58 -
 59
59 -
 60
60 -
 61
61 -
 62
62 -
 63
63 -
 64
64 -
 65
65 -
 66
66 -
 67
67 -
 68
68 -
 69
69 -
 70
70 -
 71
71 -
 72
72 -
 73
73 -
 74
74 -
 75
75 -
 76
76 -
77
-
78
-
79
-
80
-
81
-
82
-
83
-
84
-
85
-
86
-
87
-
88
-
89
-
90
-
91
-
92
-
93
-
94
-
95
-
96
-
97
-
98
-
99
-
100
-
101
-
102
-
103
-
104
-
105
-
106
-
107
-
108
-
109
-
110
-
111
-
112
-
113
-
114
-
115
-
116
-
117
-
118
-
119
-
120
-
121
-
122
-
123
-
124
-
125
-
126
-
127
-
128
-
129
-
130
-
131
-
132
-
133
-
134
-
135
-
136
-
137
-
138
-
139
-
140
-
141
-
142
-
143
-
144
-
145
-
146
-
147
-
148
-
149
-
150
-
151
-
152
-
153
-
154
-
155
-
156
-
157
-
158
-
159
-
160
-
161
-
162
-
163
-
164
-
165
-
166
-
167
-
168
 |
 |

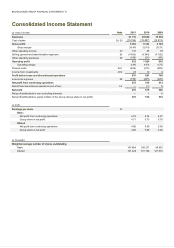
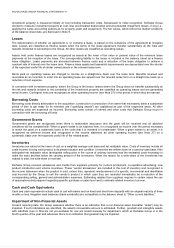
64 // DELHAIZE GROUP FINANCIAL STATEMENTS ’11
Consolidated Income Statement
(in millions of EUR) Note 2011 2010 2009
Revenues
21 119
20 850
19 938
Cost of sales
24, 25 (15 756) (15 497) (14 813)
Gross profit
5 363
5 353
5 125
Gross margin
25.4%
25.7%
25.7%
Other operating income
27
118
85
78
Selling, general and administrative expenses
24
(4 500)
(4 394)
(4 192)
Other operating expenses
28 (169) (20) (69)
Operating profit
812
1 024
942
Operating margin
3.8%
4.9%
4.7%
Finance costs
29.1
(204)
(215)
(208)
Income from investments 29.2 23 12 6
Profit before taxes and discontinued operations
631
821
740
Income tax expense
22
(156)
(245)
(228)
Net profit from continuing operations
475
576
512
Result from discontinued operations (net of tax) 5.3 — (1) 8
Net profit
475
575
520
Net profit attributable to non-controlling interests
—
1
6
Net profit attributable to equity holders of the Group (Group share in net profit)
475
574
514
(in EUR)
Earnings per share
31
Basic
Net profit from continuing operations
4.72
5.74
5.07
Group share in net profit
4.71
5.73
5.16
Diluted
Net profit from continuing operations
4.68
5.69
5.00
Group share in net profit
4.68
5.68
5.08
(in thousands)
Weighted average number of shares outstanding
Basic
100 684
100 271
99 803
Diluted
101 426
101 160
101 574