Food Lion 2011 Annual Report Download - page 68
Download and view the complete annual report
Please find page 68 of the 2011 Food Lion annual report below. You can navigate through the pages in the report by either clicking on the pages listed below, or by using the keyword search tool below to find specific information within the annual report.-
 1
1 -
2
-
3
-
4
-
5
-
6
-
7
-
8
-
9
-
10
-
11
-
12
-
13
-
14
-
15
-
16
-
17
-
18
-
19
-
20
-
21
-
22
-
23
-
24
-
25
-
26
-
27
-
28
-
29
-
30
-
31
-
32
-
33
-
34
-
35
-
36
-
37
-
38
-
39
-
40
-
41
-
42
-
43
-
44
-
45
-
46
-
47
-
48
-
49
-
50
-
51
-
52
-
53
-
54
-
55
-
56
-
57
-
 58
58 -
 59
59 -
 60
60 -
 61
61 -
 62
62 -
 63
63 -
 64
64 -
 65
65 -
 66
66 -
 67
67 -
 68
68 -
 69
69 -
 70
70 -
 71
71 -
 72
72 -
 73
73 -
 74
74 -
 75
75 -
 76
76 -
 77
77 -
 78
78 -
79
-
80
-
81
-
82
-
83
-
84
-
85
-
86
-
87
-
88
-
89
-
90
-
91
-
92
-
93
-
94
-
95
-
96
-
97
-
98
-
99
-
100
-
101
-
102
-
103
-
104
-
105
-
106
-
107
-
108
-
109
-
110
-
111
-
112
-
113
-
114
-
115
-
116
-
117
-
118
-
119
-
120
-
121
-
122
-
123
-
124
-
125
-
126
-
127
-
128
-
129
-
130
-
131
-
132
-
133
-
134
-
135
-
136
-
137
-
138
-
139
-
140
-
141
-
142
-
143
-
144
-
145
-
146
-
147
-
148
-
149
-
150
-
151
-
152
-
153
-
154
-
155
-
156
-
157
-
158
-
159
-
160
-
161
-
162
-
163
-
164
-
165
-
166
-
167
-
168
 |
 |

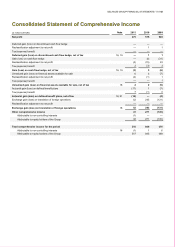
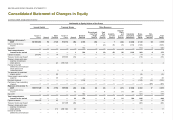
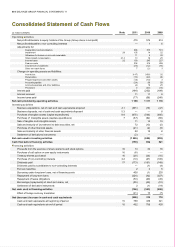
66 // DELHAIZE GROUP FINANCIAL STATEMENTS ’11
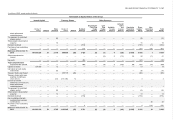
Consolidated Statement of Changes in Equity
(in millions of EUR, except number of shares)
Attributable to Equity Holders of the Group
Issued Capital Treasury Shares Other Reserves
Number of
Shares Amount
Share
Premium
Number of
Shares Amount
Retained
Earnings
Discontinued
Cash Flow
Hedge
Reserve
Cash
Flow
Hedge
Reserve
Available-
for-sale
Reserve
Actuarial
Gains
and
Losses
Reserve
Cumulative
Translation
Adjustment
Share-
holders’
Equity
Non-
controlling
Interests
Total
Equity
Balances at January 1,
2009
100 583 284
50
2 725
914 716
(56)
2 678
(10)
—
7
(22)
(1 229)
4 143
52
4 195
Other comprehensive
income
— — — — 1 — 1 (6) (5) (5) (131) (145) — (145)
Net profit — — — — — 514 — — — — — 514 6 520
Total comprehensive
income for the period
—
—
—
—
1
514
1
(6)
(5)
(5)
(131)
369
6
375
Capital increases
287 342
—
14
—
—
—
—
—
—
—
—
14
—
14
Treasury shares purchased
—
—
—
205 882
(10)
—
—
—
—
—
—
(10)
—
(10)
Treasury shares sold upon
exercise of employee
stock options
—
—
(7)
(165 012)
11
—
—
—
—
—
—
4
—
4
Excess tax benefit
(deficiency) on employee
stock options and
restricted shares
—
—
2
—
—
—
—
—
—
—
—
2
—
2
Tax payment for restricted
shares vested
—
—
(2)
—
—
—
—
—
—
—
—
(2)
—
(2)
Share-based compensation
expense
—
—
20
—
—
—
—
—
—
—
—
20
—
20
Dividend declared
—
—
—
—
—
(148)
—
—
—
—
—
(148)
(4)
(152)
Purchase of non-controlling
interests
— — — — — — — — — — — — (37) (37)
Balances at December 31,
2009
100 870 626
50
2 752
955 586
(54)
3 044
(9)
(6)
2
(27)
(1 360)
4 392
17
4 409
Other comprehensive
income
—
—
—
—
(1)
—
—
5
2
(1)
266
271
—
271
Net profit — — — — — 574 — — — — — 574 1 575
Total comprehensive
income for the period
—
—
—
—
(1)
574
—
5
2
(1)
266
845
1
846
Capital increases
684 655
1
25
—
—
—
—
—
—
—
—
26
—
26
Treasury shares purchased
—
—
—
441 996
(26)
—
—
—
—
—
—
(26)
—
(26)
Treasury shares sold upon
exercise of employee
stock options
—
—
(11)
(408 722)
22
—
—
—
—
—
—
11
—
11
Excess tax benefit
(deficiency) on employee —
—
1
—
—
—
—
—
—
—
—
1
—
1