Food Lion 2011 Annual Report Download - page 119
Download and view the complete annual report
Please find page 119 of the 2011 Food Lion annual report below. You can navigate through the pages in the report by either clicking on the pages listed below, or by using the keyword search tool below to find specific information within the annual report.
DELHAIZE GROUP FINANCIAL STATEMENTS ’11 // 117
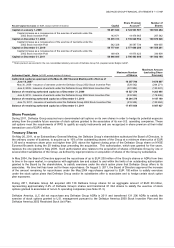
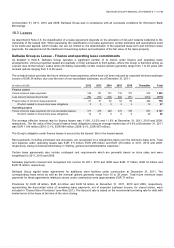
Free cash flow is defined as cash flow before financing activities, investments in debt securities and sale and maturity of debt
securities and can be summarized as follows:
(in millions of EUR) 2011
Net cash provided by operating activities
1 106
Net cash used in investing activities
(1 265)
Sale of debt securities (net) (72)
Free cash flow
(231)
Cash used in investing activities was significantly impacted by the acquisition of Delta Maxi (EUR 574 million, see Note 4.1).
19. Derivative Financial Instruments and Hedging
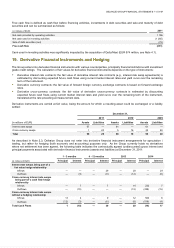
The Group enters into derivative financial instruments with various counterparties, principally financial institutions with investment
grade credit ratings. The calculation of fair values for derivative financial instruments depends on the type of instruments:
• Derivative interest rate contracts: the fair value of derivative interest rate contracts (e.g., interest rate swap agreements) is
estimated by discounting expected future cash flows using current market interest rates and yield curve over the remaining
term of the instrument.
• Derivative currency contracts: the fair value of forward foreign currency exchange contracts is based on forward exchange
rates.
• Derivative cross-currency contracts: the fair value of derivative cross-currency contracts is estimated by discounting
expected future cash flows using current market interest rates and yield curve over the remaining term of the instrument,
translated at the rate prevailing at measurement date.
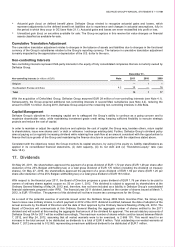
Derivative instruments are carried at fair value, being the amount for which a resulting asset could be exchanged or a liability
settled:
December 31,
2011 2010 2009
(in millions of EUR)
Assets Liabilities Assets Liabilities Assets Liabilities
Interest rate swaps
57 — 61 — 61 —
Cross currency swaps
1 20 5 16 35 40
Total
58 20 66 16 96 40
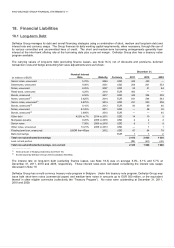
As described in Note 2.3, Delhaize Group does not enter into derivative financial instrument arrangements for speculation /
trading, but rather for hedging (both economic and accounting) purposes only. As the Group currently holds no derivatives
where net settlement has been agreed, the following table indicates the contractually agreed (undiscounted) gross interest and
principal payments associated with derivative financial instruments (assets and liabilities) at December 31, 2011:
(in millions of EUR)
1 - 3 months 4 - 12 months 2013 2014
Principal Interest Principal Interest Principal Interest Principal Interest
Interest rate swaps being part of a
fair value hedge relationship
Inflows
—
—
—
29
—
29
—
29
Outflows
—
(3)
—
(9)
—
(12)
—
(6)
Cross-currency interest rate swaps
being part of a cash flow hedge
relationship
Inflows
—
7
—
7
—
14
232
7
Outflows
—
(15)
—
—
—
(15)
(228)
(15)
Cross-currency interest rate swaps
without a hedging relationship
Inflows
13
4
—
9
—
12
500
6
Outflows (12) (3) — (6) — (8) (518) (4)
Total Cash Flows
1
(10)
—
30
—
20
(14)
17


