Food Lion 2011 Annual Report Download - page 139
Download and view the complete annual report
Please find page 139 of the 2011 Food Lion annual report below. You can navigate through the pages in the report by either clicking on the pages listed below, or by using the keyword search tool below to find specific information within the annual report.-
 1
1 -
2
-
3
-
4
-
5
-
6
-
7
-
8
-
9
-
10
-
11
-
12
-
13
-
14
-
15
-
16
-
17
-
18
-
19
-
20
-
21
-
22
-
23
-
24
-
25
-
26
-
27
-
28
-
29
-
30
-
31
-
32
-
33
-
34
-
35
-
36
-
37
-
38
-
39
-
40
-
41
-
42
-
43
-
44
-
45
-
46
-
47
-
48
-
49
-
50
-
51
-
52
-
53
-
54
-
55
-
56
-
57
-
58
-
59
-
60
-
61
-
62
-
63
-
64
-
65
-
66
-
67
-
68
-
69
-
70
-
71
-
72
-
73
-
74
-
75
-
76
-
77
-
78
-
79
-
80
-
81
-
82
-
83
-
84
-
85
-
86
-
87
-
88
-
89
-
90
-
91
-
92
-
93
-
94
-
95
-
96
-
97
-
98
-
99
-
100
-
101
-
102
-
103
-
104
-
105
-
106
-
107
-
108
-
109
-
110
-
111
-
112
-
113
-
114
-
115
-
116
-
117
-
118
-
119
-
120
-
121
-
122
-
123
-
124
-
125
-
126
-
127
-
128
-
 129
129 -
 130
130 -
 131
131 -
 132
132 -
 133
133 -
 134
134 -
 135
135 -
 136
136 -
 137
137 -
 138
138 -
 139
139 -
 140
140 -
 141
141 -
 142
142 -
 143
143 -
 144
144 -
 145
145 -
 146
146 -
 147
147 -
 148
148 -
 149
149 -
150
-
151
-
152
-
153
-
154
-
155
-
156
-
157
-
158
-
159
-
160
-
161
-
162
-
163
-
164
-
165
-
166
-
167
-
168
 |
 |

DELHAIZE GROUP FINANCIAL STATEMENTS ’11 // 137
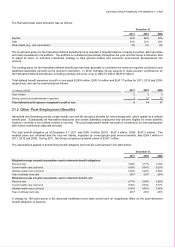
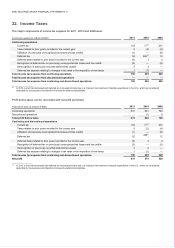
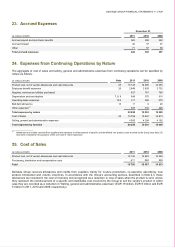
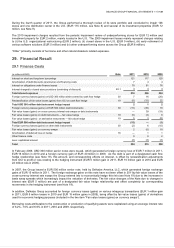
23. Accrued Expenses
24. Expenses from Continuing Operations by Nature
The aggregate of cost of sales and selling, general and administrative expenses from continuing operations can be specified by
nature as follows:
(in millions of EUR) Note 2011 2010 2009
Product cost, net of vendor allowances and cash discounts
25
15 145
14 905
14 255
Employee benefit expenses
26
2 849
2 839
2 752
Supplies, services and utilities purchased
827
761
765
Depreciation and amortization
7, 8, 9
586
575
515
Operating lease expenses
18.3
311
295
270
Bad debt allowance
14
11
6
20
Other expenses(1)
527
510
428
Total expenses by nature
20 256
19 891
19 005
Cost of Sales
25
15 756
15 497
14 813
Selling, general and administrative expenses
4 500
4 394
4 192
Total expenses by function
20 256
19 891
19 005
(1) Allowances and credits received from suppliers that represent a reimbursement of specific and identifiable non-product costs incurred by the Group (see Note 25)
have been included for the purposes of this overview in “Other expenses.”
25. Cost of Sales
(in millions of EUR) 2011 2010 2009
Product cost, net of vendor allowances and cash discounts
15 145
14 905
14 255
Purchasing, distribution and transportation costs
611 592 558
Total
15 756
15 497
14 813
Delhaize Group receives allowances and credits from suppliers mainly for in-store promotions, co-operative advertising, new
product introduction and volume incentives. In accordance with the Group’s accounting policies, described in Note 2.3, these
allowances are included in the cost of inventory and recognized as a reduction to cost of sales when the product is sold, unless
they represent the reimbursement of a specific and identifiable cost incurred by the Group to sell the vendor’s product in which
case they are recorded as a reduction in “Selling, general and administrative expenses” (EUR 18 million, EUR 9 million and EUR
5 million in 2011, 2010 and 2009, respectively).
(in millions of EUR)
December 31,
2011 2010 2009
Accrued payroll and short-term benefits
329
299
302
Accrued interest
42
37
37
Other
71
57
58
Total accrued expenses
442
393
397