Food Lion 2011 Annual Report Download - page 88
Download and view the complete annual report
Please find page 88 of the 2011 Food Lion annual report below. You can navigate through the pages in the report by either clicking on the pages listed below, or by using the keyword search tool below to find specific information within the annual report.-
 1
1 -
2
-
3
-
4
-
5
-
6
-
7
-
8
-
9
-
10
-
11
-
12
-
13
-
14
-
15
-
16
-
17
-
18
-
19
-
20
-
21
-
22
-
23
-
24
-
25
-
26
-
27
-
28
-
29
-
30
-
31
-
32
-
33
-
34
-
35
-
36
-
37
-
38
-
39
-
40
-
41
-
42
-
43
-
44
-
45
-
46
-
47
-
48
-
49
-
50
-
51
-
52
-
53
-
54
-
55
-
56
-
57
-
58
-
59
-
60
-
61
-
62
-
63
-
64
-
65
-
66
-
67
-
68
-
69
-
70
-
71
-
72
-
73
-
74
-
75
-
76
-
77
-
 78
78 -
 79
79 -
 80
80 -
 81
81 -
 82
82 -
 83
83 -
 84
84 -
 85
85 -
 86
86 -
 87
87 -
 88
88 -
 89
89 -
 90
90 -
 91
91 -
 92
92 -
 93
93 -
 94
94 -
 95
95 -
 96
96 -
 97
97 -
 98
98 -
99
-
100
-
101
-
102
-
103
-
104
-
105
-
106
-
107
-
108
-
109
-
110
-
111
-
112
-
113
-
114
-
115
-
116
-
117
-
118
-
119
-
120
-
121
-
122
-
123
-
124
-
125
-
126
-
127
-
128
-
129
-
130
-
131
-
132
-
133
-
134
-
135
-
136
-
137
-
138
-
139
-
140
-
141
-
142
-
143
-
144
-
145
-
146
-
147
-
148
-
149
-
150
-
151
-
152
-
153
-
154
-
155
-
156
-
157
-
158
-
159
-
160
-
161
-
162
-
163
-
164
-
165
-
166
-
167
-
168
 |
 |

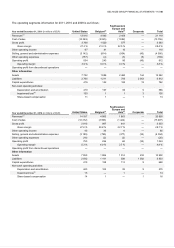
86 // DELHAIZE GROUP FINANCIAL STATEMENTS ’11
Year ended December 31, 2009 (in millions of EUR) United States Belgium(2)
Southeastern
Europe and
Asia(3) Corporate Total
Revenues(1)
13 618
4 616
1 704
—
19 938
Cost of sales
(9 817)
(3 690)
(1 306)
—
(14 813)
Gross profit
3 801
926
398
—
5 125
Gross margin
27.9 %
20.0 %
23.4 %
—
25.7%
Other operating income
34
36
8
—
78
Selling, general and administrative expenses
(3 046)
(772)
(346)
(28)
(4 192)
Other operating expenses
(60)
(5)
(2)
(2)
(69)
Operating profit
729
185
58
(30)
942
Operating margin
5.4 %
4.0 %
3.4 %
—
4.7 %
Operating profit from discontinued operations
—
1
—
—
1
Other information
Assets
6 927
1 750
897
174
9 748
Liabilities
2 670
1 027
550
1 092
5 339
Capital expenditures
331
115
70
4
520
Non-cash operating activities:
Depreciation and amortization
381
89
36
9
515
Impairment loss(4)
17
3
—
2
22
Share-based compensation
18
1
—
1
20
_______________
(1) All revenues are from external parties.
(2) Belgium includes Delhaize Group’s operations in Belgium and the Grand Duchy of Luxembourg.
(3) Southeastern Europe and Asia includes in 2011 the Group’s operations in Greece, Romania, Serbia, Bulgaria, Bosnia and Herzegovina, Montenegro, Albania
and Indonesia and in 2010 and 2009 the Group’s operations in Greece, Romania and Indonesia.
(4) No impairment loss was recorded or reversed in equity.
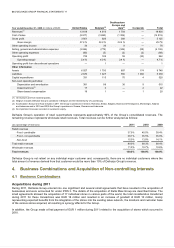
Delhaize Group’s operation of retail supermarkets represents approximately 90% of the Group’s consolidated revenues. The
remaining revenue represents wholesale retail revenues. Total revenues can be further analyzed as follows:
(as a percentage of revenues) 2011 2010 2009
Retail revenues
- Food - perishable
37.9%
40.0%
39.4%
- Food - non-perishable
36.1%
35.5%
35.9%
- Non-food 15.0% 13.8% 14.1%
Total retail revenues
89.0%
89.3%
89.4%
Wholesale revenues 11.0% 10.7% 10.6%
Total revenues
100.0%
100.0%
100.0%
Delhaize Group is not reliant on any individual major customer and, consequently, there are no individual customers where the
total amount of revenue derived from that customer would be more than 10% of Delhaize Group’s revenue.
4. Business Combinations and Acquisition of Non-controlling Interests
4.1 Business Combinations
Acquisitions during 2011
During 2011, Delhaize Group entered into one significant and several small agreements that have resulted in the acquisition of
businesses and were accounted for under IFRS 3. The details of the acquisition of Delta Maxi Group are described below. The
small agreements allowed the acquisition of 17 individual stores in various parts of the world, the total consideration transferred
during 2011 for these transactions was EUR 16 million and resulted in an increase of goodwill of EUR 10 million, mainly
representing expected benefits from the integration of the stores into the existing sales network, the locations and customer base
of the various stores acquired, all resulting in synergy effects for the Group.
In addition, the Group made a final payment of EUR 1 million during 2011 related to the acquisition of stores which occurred in
2010.