Thrifty Car Rental 2010 Annual Report Download - page 80
Download and view the complete annual report
Please find page 80 of the 2010 Thrifty Car Rental annual report below. You can navigate through the pages in the report by either clicking on the pages listed below, or by using the keyword search tool below to find specific information within the annual report.-
 1
1 -
2
-
3
-
4
-
5
-
6
-
7
-
8
-
9
-
10
-
11
-
12
-
13
-
14
-
15
-
16
-
17
-
18
-
19
-
20
-
21
-
22
-
23
-
24
-
25
-
26
-
27
-
28
-
29
-
30
-
31
-
32
-
33
-
34
-
35
-
36
-
37
-
38
-
39
-
40
-
41
-
42
-
43
-
44
-
45
-
46
-
47
-
48
-
49
-
50
-
51
-
52
-
53
-
54
-
55
-
56
-
57
-
58
-
59
-
60
-
61
-
62
-
63
-
64
-
65
-
66
-
67
-
68
-
69
-
 70
70 -
 71
71 -
 72
72 -
 73
73 -
 74
74 -
 75
75 -
 76
76 -
 77
77 -
 78
78 -
 79
79 -
 80
80 -
 81
81 -
 82
82 -
 83
83 -
 84
84 -
 85
85 -
 86
86 -
 87
87 -
 88
88 -
 89
89 -
 90
90 -
91
-
92
-
93
-
94
-
95
-
96
-
97
-
98
-
99
-
100
-
101
-
102
-
103
-
104
-
105
-
106
-
107
-
108
-
109
-
110
-
111
-
112
-
113
-
114
-
115
-
116
-
117
 |
 |

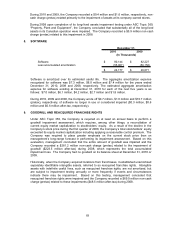
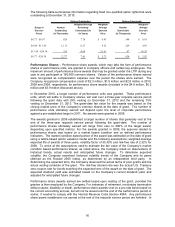
grant. During 2010, there were no stock option awards granted. The assumptions used to
calculate compensation expense relating to the stock option awards granted during 2009 and
2008 were as follows:
2009 2008
Weighted-average expected life (in years) 5 5
Expected price volatility 80.24% 53.31%
Risk-free interest rate 2.36% 3.19%
Dividend payments 0 0
The weighted average grant-date fair value of options issued in 2009 and 2008 was $4.44 and
$7.58, respectively. The options issued in May 2009 vest in installments over three years with
20% exercisable in each of 2010 and 2011 and the remaining 60% exercisable in 2012. The
options issued in October 2008 vest ratably over three years and the options issued in January
2008 vest at the end of three years. Expense is recognized over the service period which is the
vesting period. Unrecognized expense remaining for the options at December 31, 2010, 2009
and 2008 was $0.9 million, $3.0 million and $2.9 million, respectively.
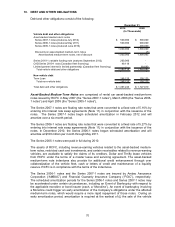
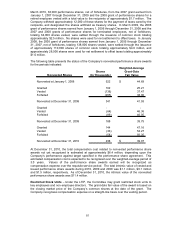
The following table sets forth the non-qualified option rights activity for non-qualified option
rights under the LTIP for the periods indicated:
Weighted
Weighted Average Aggregate
Number of Average Remaining Intrinsic
Shares Exercise Contractual Value
(In Thousands) Price Term (In Thousands)
Outstanding at January 1, 2008 465 17.49$ 2.63 2,883$
Granted 1,258 7.58
Exercised (3) 11.10
Canceled (118) 18.44
Outstanding at December 31, 2008 1,602 9.65 7.05 122$
Granted 1,120 4.44
Exercised (137) 16.78
Canceled (134) 15.43
Outstanding at December 31, 2009 2,451 6.55 8.11 46,702$
Granted - -
Exercised (173) 17.29
Canceled (1) 19.38
Outstanding at December 31, 2010 2,277 5.73$ 7.61 94,545$
Fully vested options at:
December 31, 2010 824 3.02$ 7.64 36,466$
Options expected to vest in the future at:
December 31, 2010 1,453 7.27$ 7.59 58,079$
The total intrinsic value of options exercised during 2010, 2009 and 2008 was $3.8 million, $0.6
million, and $28,000, respectively. Total cash received by the Company for non-qualified
option rights exercised during 2010, 2009 and 2008 totaled $3.0 million, $2.3 million and
$30,000, respectively. The Company deems a tax benefit to be realized when the benefit
provides incremental benefit by reducing current taxes payable that it otherwise would have
had to pay absent the share-based compensation deduction (the “with-and-without” approach).
Under this approach, share-based compensation deductions are, effectively, always considered
last to be realized. The Company realized $0.4 million and $1.3 million in tax benefits for the
options exercised during 2010 and 2009, respectively, due to full utilization of the net operating
losses in 2009. The Company did not realize any tax benefits from option exercises during
2008.
79