Thrifty Car Rental 2010 Annual Report Download - page 35
Download and view the complete annual report
Please find page 35 of the 2010 Thrifty Car Rental annual report below. You can navigate through the pages in the report by either clicking on the pages listed below, or by using the keyword search tool below to find specific information within the annual report.-
 1
1 -
2
-
3
-
4
-
5
-
6
-
7
-
8
-
9
-
10
-
11
-
12
-
13
-
14
-
15
-
16
-
17
-
18
-
19
-
20
-
21
-
22
-
23
-
24
-
 25
25 -
 26
26 -
 27
27 -
 28
28 -
 29
29 -
 30
30 -
 31
31 -
 32
32 -
 33
33 -
 34
34 -
 35
35 -
 36
36 -
 37
37 -
 38
38 -
 39
39 -
 40
40 -
 41
41 -
 42
42 -
 43
43 -
 44
44 -
 45
45 -
46
-
47
-
48
-
49
-
50
-
51
-
52
-
53
-
54
-
55
-
56
-
57
-
58
-
59
-
60
-
61
-
62
-
63
-
64
-
65
-
66
-
67
-
68
-
69
-
70
-
71
-
72
-
73
-
74
-
75
-
76
-
77
-
78
-
79
-
80
-
81
-
82
-
83
-
84
-
85
-
86
-
87
-
88
-
89
-
90
-
91
-
92
-
93
-
94
-
95
-
96
-
97
-
98
-
99
-
100
-
101
-
102
-
103
-
104
-
105
-
106
-
107
-
108
-
109
-
110
-
111
-
112
-
113
-
114
-
115
-
116
-
117
 |
 |

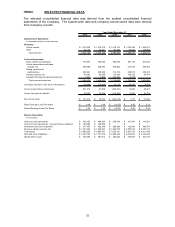
ITEM 7. MANAGEMENT’S DISCUSSION AND ANALYSIS OF FINANCIAL CONDITION
AND RESULTS OF OPERATIONS
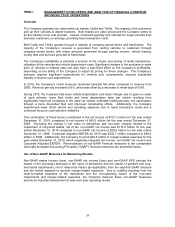
Overview
The Company operates two value rental car brands, Dollar and Thrifty. The majority of its customers
pick up their vehicles at airport locations. Both brands are value priced and the Company seeks to
be the industry’s low cost provider. Leisure customers typically rent vehicles for longer periods than
business customers, on average, providing lower transaction costs.
Both Dollar and Thrifty operate through a network of company-owned stores and franchisees. The
majority of the Company’s revenue is generated from renting vehicles to customers through
company-owned stores, with lesser amounts generated through parking income, vehicle leasing,
royalty fees and services provided to franchisees.
The Company’s profitability is primarily a function of the volume and pricing of rental transactions,
utilization of the vehicles and vehicle depreciation costs. Significant changes in the purchase or sales
price of vehicles or interest rates can also have a significant effect on the Company’s profitability,
depending on the ability of the Company to adjust its pricing for these changes. The Company’s
business requires significant expenditures for vehicles and, consequently, requires substantial
liquidity to finance such expenditures.
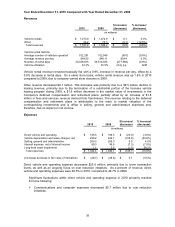
In 2010, the Company’s rental revenues remained basically flat when compared to revenue from
2009. Revenue per day increased 0.9%, which was offset by a decrease in rental days of 0.9%.
During 2010, the Company had lower vehicle depreciation and lease charges due to gains on sales
of used vehicles, lower fleet levels and lower depreciation rates per vehicle resulting from
significantly improved conditions in the used car market, extended holding periods, mix optimization
through a more diversified fleet and improved remarketing efforts. Additionally, the Company
experienced lower direct vehicle and operating expenses due to lower transaction levels and a
continued focus on cost reduction initiatives.
The combination of these factors contributed to the net income of $131.2 million for the year ended
December 31, 2010, compared to net income of $45.0 million for the year ended December 31,
2009. Excluding the change in fair value of derivatives and non-cash charges related to the
impairment of long-lived assets, net of tax, non-GAAP net income was $115.0 million for the year
ended December 31, 2010 compared to non-GAAP net income of $29.6 million for the year ended
December 31, 2009. Corporate Adjusted EBITDA for 2010 was $235.7 million compared to $99.4
million in 2009. Additionally, the Company incurred $22.6 million in merger-related expenses for the
year ended December 31, 2010, which negatively impacted net income, non-GAAP net income and
Corporate Adjusted EBITDA. Reconciliations of non-GAAP financial measures to the comparable
Generally Accepted Accounting Principles (“GAAP”) financial measures are presented below.
Use of Non-GAAP Measures for Measuring Results
Non-GAAP pretax income (loss), non-GAAP net income (loss) and non-GAAP EPS exclude the
impact of the (increase) decrease in fair value of derivatives and the impact of goodwill and long-
lived asset impairments, net of related tax impact (as applicable), from the reported GAAP measure
and are further adjusted to exclude merger-related expenses. Due to volatility resulting from the
mark-to-market treatment of the derivatives and the non-operating nature of the non-cash
impairments and merger-related expenses, the Company believes these non-GAAP measures
provide an important assessment of year-over-year operating results.
34