Thrifty Car Rental 2010 Annual Report Download - page 34
Download and view the complete annual report
Please find page 34 of the 2010 Thrifty Car Rental annual report below. You can navigate through the pages in the report by either clicking on the pages listed below, or by using the keyword search tool below to find specific information within the annual report.
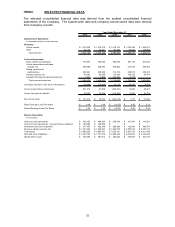
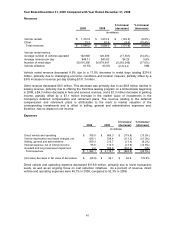
U. S. and Canada
2010 2009 2008 2007 2006
System-wide Data:
Rental locations:
Company-owned stores 297 296 400 466 407
Franchisee locations 308 317 341 365 429
Total rental locations 605 613 741 831 836
Company-owned Stores Data:
Vehicle rental data:
Average number of vehicles operated 102,291 102,948 120,309 123,484 119,648
Number of rental days 30,338,815 30,616,395 36,879,641 37,231,340 36,642,026
Vehicle utilization 81.3% 81.5% 83.8% 82.6% 83.9%
Average revenue per day 48.55$ 48.11$ 43.82$ 45.03$ 41.99$
Monthly average revenue per vehicle 1,200$ 1,192$ 1,119$ 1,131$ 1,072$
Average depreciable fleet 103,207 105,301 123,673 127,979 128,739
Monthly average depreciation
(net) per vehicle 242$ 337$ 363$ 311$ 246$
Year Ended December 31,
33


