Thrifty Car Rental 2010 Annual Report Download - page 76
Download and view the complete annual report
Please find page 76 of the 2010 Thrifty Car Rental annual report below. You can navigate through the pages in the report by either clicking on the pages listed below, or by using the keyword search tool below to find specific information within the annual report.-
 1
1 -
2
-
3
-
4
-
5
-
6
-
7
-
8
-
9
-
10
-
11
-
12
-
13
-
14
-
15
-
16
-
17
-
18
-
19
-
20
-
21
-
22
-
23
-
24
-
25
-
26
-
27
-
28
-
29
-
30
-
31
-
32
-
33
-
34
-
35
-
36
-
37
-
38
-
39
-
40
-
41
-
42
-
43
-
44
-
45
-
46
-
47
-
48
-
49
-
50
-
51
-
52
-
53
-
54
-
55
-
56
-
57
-
58
-
59
-
60
-
61
-
62
-
63
-
64
-
65
-
 66
66 -
 67
67 -
 68
68 -
 69
69 -
 70
70 -
 71
71 -
 72
72 -
 73
73 -
 74
74 -
 75
75 -
 76
76 -
 77
77 -
 78
78 -
 79
79 -
 80
80 -
 81
81 -
 82
82 -
 83
83 -
 84
84 -
 85
85 -
 86
86 -
87
-
88
-
89
-
90
-
91
-
92
-
93
-
94
-
95
-
96
-
97
-
98
-
99
-
100
-
101
-
102
-
103
-
104
-
105
-
106
-
107
-
108
-
109
-
110
-
111
-
112
-
113
-
114
-
115
-
116
-
117
 |
 |

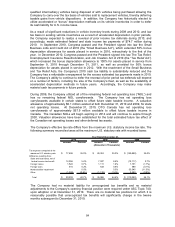
At December 31, 2010, the Company’s interest rate contracts related to the 2007 Swap and the
2010-2 Cap were effectively hedged, and no ineffectiveness was recorded in income. Based
on projected market interest rates, the Company estimates that approximately $13.9 million of
net deferred loss related to the 2007 Swap and the 2010-2 Cap will be reclassified into
earnings within the next 12 months.
12. FAIR VALUE MEASUREMENTS
Financial instruments are presented at fair value in the Company’s balance sheets. Fair value
is defined as the price which would be received to sell an asset or paid to transfer a liability in
an orderly transaction between market participants at the measurement date. Assets and
liabilities recorded at fair value in the balance sheets are categorized based upon the level of
judgment associated with the inputs used to measure their fair values. These categories
include (in descending order of priority): Level 1, defined as observable inputs such as quoted
prices in active markets; Level 2, defined as inputs other than quoted prices in active markets
that are either directly or indirectly observable; and Level 3, defined as unobservable inputs in
which little or no market data exists, therefore requiring an entity to develop its own
assumptions.
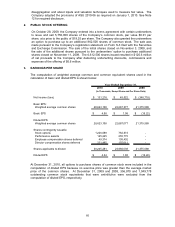
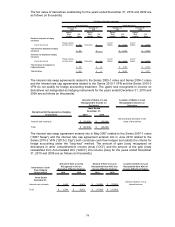
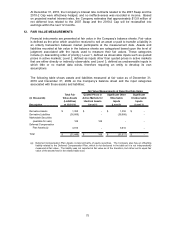
The following table shows assets and liabilities measured at fair value as of December 31,
2010 and December 31, 2009 on the Company’s balance sheet and the input categories
associated with those assets and liabilities:
Total Fair Quoted Prices in Significant Other Significant
(in thousands) Value Assets Active Markets for Observable Unobservable
(Liabilities) Identical Assets Inputs Inputs
Description at 12/31/10 (Level 1) (Level 2) (Level 3)
Derivative Assets 1,355$ -$ 1,355$ -$
Derivative Liabilities (36,888) - (36,888) -
Marketable Securities
(available for sale) 169 169 - -
Deferred Compensation
Plan Assets (a) 3,916 - 3,916 -
Total (31,448)$ 169$ (31,617)$ -$
Fair Value Measurements at Reporting Date Using
(a) Deferred Compensation Plan Assets consist primarily of equity securities. The Company also has an offsetting
liability related to the Deferred Compensation Plan, which is not disclosed in the table as it is not independently
measured at fair value. The liability was not reported at fair value as of the transition, but rather set to equal fair
value of the assets held in the related rabbi trust.
75