Thrifty Car Rental 2010 Annual Report Download - page 53
Download and view the complete annual report
Please find page 53 of the 2010 Thrifty Car Rental annual report below. You can navigate through the pages in the report by either clicking on the pages listed below, or by using the keyword search tool below to find specific information within the annual report.-
 1
1 -
2
-
3
-
4
-
5
-
6
-
7
-
8
-
9
-
10
-
11
-
12
-
13
-
14
-
15
-
16
-
17
-
18
-
19
-
20
-
21
-
22
-
23
-
24
-
25
-
26
-
27
-
28
-
29
-
30
-
31
-
32
-
33
-
34
-
35
-
36
-
37
-
38
-
39
-
40
-
41
-
42
-
 43
43 -
 44
44 -
 45
45 -
 46
46 -
 47
47 -
 48
48 -
 49
49 -
 50
50 -
 51
51 -
 52
52 -
 53
53 -
 54
54 -
 55
55 -
 56
56 -
 57
57 -
 58
58 -
 59
59 -
 60
60 -
 61
61 -
 62
62 -
 63
63 -
64
-
65
-
66
-
67
-
68
-
69
-
70
-
71
-
72
-
73
-
74
-
75
-
76
-
77
-
78
-
79
-
80
-
81
-
82
-
83
-
84
-
85
-
86
-
87
-
88
-
89
-
90
-
91
-
92
-
93
-
94
-
95
-
96
-
97
-
98
-
99
-
100
-
101
-
102
-
103
-
104
-
105
-
106
-
107
-
108
-
109
-
110
-
111
-
112
-
113
-
114
-
115
-
116
-
117
 |
 |

New Accounting Standards
For a discussion on new accounting standards refer to Item 8 - Note 1 of Notes to Consolidated
Financial Statements.
Outlook for 2011
The Company expects further recovery in travel activity as the economy continues to improve. The
Company also expects the revenue per day environment to be competitive, resulting in flat pricing for
2011 compared to 2010. The Company’s guidance is based on a slightly less robust used vehicle
market in 2011 as compared to 2010. In particular, Corporate Adjusted EBITDA in 2010 benefitted
from approximately $63 million in gains on disposition of risk vehicles that were partially a
consequence of the rapid recovery in the used vehicle market from historic lows in 2009, and the
Company’s guidance reflects a depreciation and residual value environment more in line with
normalized historical levels.
Based on the above expectations and the additional information outlined below, the Company is
targeting Corporate Adjusted EBITDA for the full year of 2011 to be within a range of $175 million to
$200 million. This estimate does not reflect the impact of merger-related expenses in 2011.
The Company provided the following additional information with respect to its full year guidance:
x Vehicle rental revenues are projected to be up 2 – 4 percent compared to 2010, with such
increases occurring primarily in the second through fourth quarters. This revenue growth is
projected to result primarily from low single-digit increases in transaction days driven by a
rebound in travel demand as a result of a slightly improving economy.
x Vehicle depreciation costs for the full year of 2011 are expected to be within the Company’s
previously announced range of $300 to $310 per vehicle per month.
x Interest expense is expected to decline significantly in 2011 compared to 2010, primarily as a
result of a reduction in the overall level of vehicle debt outstanding, combined with lower overall
interest cost on the Company’s recently completed fleet financing facilities as compared to the
fixed rates paid on maturing fleet debt facilities.
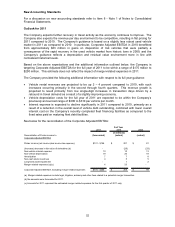
See below for the reconciliation of the Corporate Adjusted EBITDA:
Full Year
2011 2010 2009
(in millions)
Reconciliation of Pretax income to (forecasted) (actual) (actual)
Corporate Adjusted EBITDA
Pretax income (net income plus income tax expense) $131 - $156 221$ 81$
(Increase) decrease in fair value of derivatives (b) - (29) (29)
Non-vehicle interest expense 10 10 13
Non-vehicle depreciation 19 20 19
Amortization 7 7 8
Non-cash stock incentives 4 5 5
Long-lived asset impairment - 1 2
Merger-related expenses (a)(c) 4 23 -
Corporate Adjusted EBITDA, excluding merger-related expenses $175 - $200 258$ 99$
(a) Merger-related expenses include legal, litigation, advisory and other fees related to a potential merger transaction.
(b) No amounts were forecasted for 2011.
(c) Amounts for 2011 represent the estimated merger-related expenses for the first quarter of 2011 only.
52