Thrifty Car Rental 2010 Annual Report Download - page 44
Download and view the complete annual report
Please find page 44 of the 2010 Thrifty Car Rental annual report below. You can navigate through the pages in the report by either clicking on the pages listed below, or by using the keyword search tool below to find specific information within the annual report.-
 1
1 -
2
-
3
-
4
-
5
-
6
-
7
-
8
-
9
-
10
-
11
-
12
-
13
-
14
-
15
-
16
-
17
-
18
-
19
-
20
-
21
-
22
-
23
-
24
-
25
-
26
-
27
-
28
-
29
-
30
-
31
-
32
-
33
-
 34
34 -
 35
35 -
 36
36 -
 37
37 -
 38
38 -
 39
39 -
 40
40 -
 41
41 -
 42
42 -
 43
43 -
 44
44 -
 45
45 -
 46
46 -
 47
47 -
 48
48 -
 49
49 -
 50
50 -
 51
51 -
 52
52 -
 53
53 -
 54
54 -
55
-
56
-
57
-
58
-
59
-
60
-
61
-
62
-
63
-
64
-
65
-
66
-
67
-
68
-
69
-
70
-
71
-
72
-
73
-
74
-
75
-
76
-
77
-
78
-
79
-
80
-
81
-
82
-
83
-
84
-
85
-
86
-
87
-
88
-
89
-
90
-
91
-
92
-
93
-
94
-
95
-
96
-
97
-
98
-
99
-
100
-
101
-
102
-
103
-
104
-
105
-
106
-
107
-
108
-
109
-
110
-
111
-
112
-
113
-
114
-
115
-
116
-
117
 |
 |
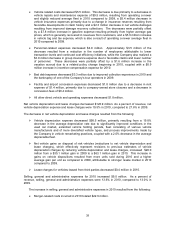
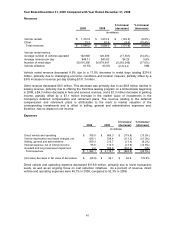
¾ The increase in the market value of investments in the Company’s deferred compensation
and retirement plans increased selling, general and administrative expenses by $7.1 million
in 2009 compared to 2008, which was offset by a corresponding gain on those investments
that is recognized in other revenue and, therefore, did not impact net income.
¾ Personnel related expenses increased $2.3 million primarily due to $6.8 million of incentive
compensation expense recorded in 2009 and a $3.0 million increase in stock option,
performance share, and retirement expense. These expenses were partially offset by a $7.2
million decrease in expense related to workforce reductions implemented during the fourth
quarter of 2008.
Net interest expense decreased $13.9 million in 2009 primarily due to lower average vehicle debt,
partially offset by a decrease in interest reimbursements due to significantly reduced vehicle
purchasing activity and the write-off of deferred financing fees related to the reduction in the capacity
of the Revolving Credit Facility and the Term Loan (hereinafter defined) during 2009. As a percent of
revenue, net interest expense was 6.2% in 2009, compared to 6.5% in 2008.
Goodwill and long-lived asset impairment expense decreased $364.2 million in 2009, due to non-
cash charges in 2008 relating to goodwill impairment of $281.2 million, reacquired franchise rights
impairment of $69.0 million, certain IT initiative write-offs of $10.5 million and impairment of
substantially all of the Company’s Canadian operations long-lived assets of $6.1 million. In 2009, the
Company wrote off $2.6 million related to the impairment of long-lived assets at its company-owned
stores and software no longer in use.
The change in fair value of the Company’s interest rate swap agreements was an increase of $28.8
million in 2009 compared to a decrease of $36.1 million in 2008 resulting in a year-over-year
increase of $64.9 million, primarily due to an increase in interest rates in 2009.
The income tax expense for 2009 was $36.0 million. The effective income tax rate was 44.4% for
2009 compared to 24.1% for 2008. The increase in the effective tax rate was primarily due to the
income tax expense related to the pretax income in 2009 compared to the pretax loss in 2008 and
the non-cash write-off of goodwill and reacquired franchise rights (of which only a portion of these
write-offs receive a deferred tax benefit) and other long-lived assets. The Company reports taxable
income for the U.S. and Canada in separate tax jurisdictions and establishes provisions separately
for each jurisdiction. On a separate, domestic basis, the U.S. effective tax rate approximates the
statutory tax rate including the effect of state income taxes and the impact of establishing valuation
allowances for net operating losses that could expire. However, no income tax benefit was recorded
for Canadian losses in 2009 or 2008, thus increasing the consolidated effective tax rate in 2009, and
reducing the consolidated effective tax rate in 2008, due to an overall pretax loss.
Operating Results
The Company had income before income taxes of $81.0 million for 2009 compared to a loss before
income taxes of $456.8 million in 2008.
Liquidity and Capital Resources
The Company’s primary uses of liquidity are for the purchase of vehicles for its rental fleet, including
required collateral enhancement under its fleet financing structures, non-vehicle capital expenditures
and working capital. The Company uses both cash and letters of credit to support asset-backed
vehicle financing programs. The Company also uses letters of credit or insurance bonds to secure
certain commitments related to airport concession agreements, insurance programs, and for other
purposes. The Company’s primary sources of liquidity are cash generated from operations, secured
vehicle financing, sales proceeds from disposal of used vehicles, letters of credit provided under the
Senior Secured Credit Facilities (hereinafter defined) and amounts payable under insurance bonds.
43