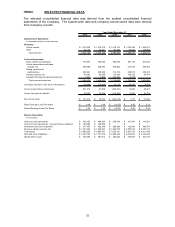
Thrifty Car Rental 2010 Annual Report Download - page 39
Download and view the complete annual report
Please find page 39 of the 2010 Thrifty Car Rental annual report below. You can navigate through the pages in the report by either clicking on the pages listed below, or by using the keyword search tool below to find specific information within the annual report.-
 1
1 -
2
-
3
-
4
-
5
-
6
-
7
-
8
-
9
-
10
-
11
-
12
-
13
-
14
-
15
-
16
-
17
-
18
-
19
-
20
-
21
-
22
-
23
-
24
-
25
-
26
-
27
-
28
-
 29
29 -
 30
30 -
 31
31 -
 32
32 -
 33
33 -
 34
34 -
 35
35 -
 36
36 -
 37
37 -
 38
38 -
 39
39 -
 40
40 -
 41
41 -
 42
42 -
 43
43 -
 44
44 -
 45
45 -
 46
46 -
 47
47 -
 48
48 -
 49
49 -
50
-
51
-
52
-
53
-
54
-
55
-
56
-
57
-
58
-
59
-
60
-
61
-
62
-
63
-
64
-
65
-
66
-
67
-
68
-
69
-
70
-
71
-
72
-
73
-
74
-
75
-
76
-
77
-
78
-
79
-
80
-
81
-
82
-
83
-
84
-
85
-
86
-
87
-
88
-
89
-
90
-
91
-
92
-
93
-
94
-
95
-
96
-
97
-
98
-
99
-
100
-
101
-
102
-
103
-
104
-
105
-
106
-
107
-
108
-
109
-
110
-
111
-
112
-
113
-
114
-
115
-
116
-
117
 |
 |

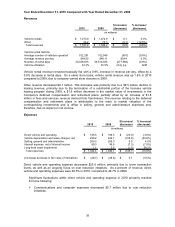
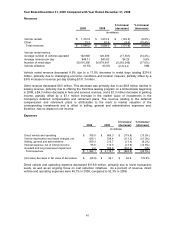
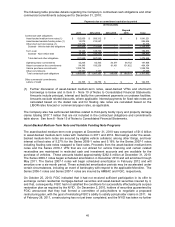
Year Ended December 31, 2010 Compared with Year Ended December 31, 2009
Revenues
$ Increase/ % Increase/
2010 2009 (decrease) (decrease)
Vehicle rentals 1,473.0$ 1,472.9$ 0.1$ 0.0%
Other 64.2 73.3 (9.1) (12.5%)
Total revenues 1,537.2$ 1,546.2$ (9.0)$ (0.6%)
Vehicle rental metrics:
Average number of vehicles operated 102,291 102,948 (657) (0.6%)
Average revenue per day $48.55 $48.11 $0.44 0.9%
Number of rental days 30,338,815 30,616,395 (277,580) (0.9%)
Vehicle utilization 81.3% 81.5% (0.2) p.p. N/M
(in millions)
Vehicle rental revenue remained basically flat with a 0.9% increase in revenue per day, offset by a
0.9% decrease in rental days. On a same store basis, vehicle rental revenue was up 1.6% in 2010
compared to 2009, due to company-owned store closures in 2009.
Other revenue decreased $9.1 million. This decrease was primarily due to a $9.5 million decline in
leasing revenue, primarily due to the termination of a substantial portion of the licensee vehicle
leasing program during 2009, a $1.8 million decrease in the market value of investments in the
Company’s deferred compensation and retirement plans, partially offset by an increase of $1.8
million in fees and services revenue derived from franchisees. The revenue relating to the deferred
compensation and retirement plans is attributable to the mark to market valuation of the
corresponding investments and is offset in selling, general and administrative expenses and,
therefore, has no impact on net income.
Expenses
$ Increase
/
% Increase/
2010 2009 (decrease) (decrease)
Direct vehicle and operating 745.5$ 768.5$ (23.0)$ (3.0%)
Vehicle depreciation and lease charges, net 299.2 426.1 (126.9) (29.8%)
Selling, general and administrative 209.3 200.3 9.0 4.5%
Interest expense, net of interest income 89.3 96.6 (7.3) (7.5%)
Long-lived asset impairment 1.1 2.6 (1.5) 59.2%
Total expenses 1,344.4$ 1,494.1$ (149.7)$ (10.0%)
(Increase) decrease in fair value of derivatives (28.7)$ (28.8)$ 0.1$ (0.5%)
(in millions)
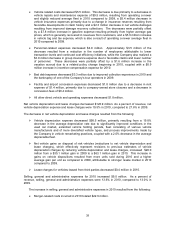
Direct vehicle and operating expense decreased $23.0 million, primarily due to lower transaction
levels, as well as an ongoing focus on cost reduction initiatives. As a percent of revenue, direct
vehicle and operating expenses were 48.5% in 2010, compared to 49.7% in 2009.
Significant fluctuations within direct vehicle and operating expense in 2010 primarily resulted
from the following:
¾Communications and computer expenses decreased $5.7 million due to cost reduction
initiatives.
38