Thrifty Car Rental 2010 Annual Report Download - page 33
Download and view the complete annual report
Please find page 33 of the 2010 Thrifty Car Rental annual report below. You can navigate through the pages in the report by either clicking on the pages listed below, or by using the keyword search tool below to find specific information within the annual report.-
 1
1 -
2
-
3
-
4
-
5
-
6
-
7
-
8
-
9
-
10
-
11
-
12
-
13
-
14
-
15
-
16
-
17
-
18
-
19
-
20
-
21
-
22
-
 23
23 -
 24
24 -
 25
25 -
 26
26 -
 27
27 -
 28
28 -
 29
29 -
 30
30 -
 31
31 -
 32
32 -
 33
33 -
 34
34 -
 35
35 -
 36
36 -
 37
37 -
 38
38 -
 39
39 -
 40
40 -
 41
41 -
 42
42 -
 43
43 -
44
-
45
-
46
-
47
-
48
-
49
-
50
-
51
-
52
-
53
-
54
-
55
-
56
-
57
-
58
-
59
-
60
-
61
-
62
-
63
-
64
-
65
-
66
-
67
-
68
-
69
-
70
-
71
-
72
-
73
-
74
-
75
-
76
-
77
-
78
-
79
-
80
-
81
-
82
-
83
-
84
-
85
-
86
-
87
-
88
-
89
-
90
-
91
-
92
-
93
-
94
-
95
-
96
-
97
-
98
-
99
-
100
-
101
-
102
-
103
-
104
-
105
-
106
-
107
-
108
-
109
-
110
-
111
-
112
-
113
-
114
-
115
-
116
-
117
 |
 |

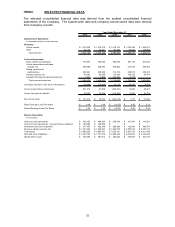
ITEM 6. SELECTED FINANCIAL DATA
The selected consolidated financial data was derived from the audited consolidated financial
statements of the Company. The system-wide data and company-owned stores data were derived
from Company records.
2010 2009 2008 2007 2006
Statements of Operations:
(in thousands except per share amounts)
Revenues:
Vehicle rentals 1,473,023$ 1,472,918$ 1,616,153$ 1,676,349$ 1,538,673$
Other 64,137 73,331 81,840 84,442 122,004
Total revenues 1,537,160 1,546,249 1,697,993 1,760,791 1,660,677
Costs and expenses:
Direct vehicle and operating 745,535 768,456 888,294 887,178 827,440
Vehicle depreciation and lease
charges, net 299,200 426,092 539,406 477,853 380,005
Selling, general and
administrative 209,341 200,389 213,734 230,515 259,474
Interest expense, net 89,303 96,560 110,424 109,728 95,974
Goodwill and long-lived asset impairment 1,057 2,592 366,822 3,719 -
Total costs and expenses 1,344,436 1,494,089 2,118,680 1,708,993 1,562,893
(Increase) decrease in fair value of derivatives (28,694) (28,848) 36,114 38,990 9,363
Income (loss) before income taxes 221,418 81,008 (456,801) 12,808 88,421
Income tax expense (benefit) 90,202 35,986 (110,083) 11,593 36,729
Net income (loss) 131,216$ 45,022$ (346,718)$ 1,215$ 51,692$
Basic Earnings (Loss) Per Share 4.58$ 1.98$ (16.22)$ 0.05$2.14$
Diluted Earnings (Loss) Per Share 4.34$ 1.88$ (16.22)$ 0.05$2.04$
Balance Sheet Data:
(in thousands)
Cash and cash equivalents 463,153$ 400,404$ 229,636$ 101,025$ 191,981$
Cash and cash equivalents - required minimum balance 100,000$ 100,000$-$ -$ -$
Restricted cash and investments 277,407$ 622,540$ 596,588$ 132,945$ 389,794$
Revenue-earning vehicles, net 1,341,822$ 1,228,637$ 1,946,079$ 2,808,354$ 2,623,719$
Total assets 2,499,528$ 2,645,937$ 3,238,181$ 3,891,452$ 4,011,498$
Debt and other obligations 1,397,243$ 1,727,810$ 2,488,245$ 2,656,562$ 2,744,284$
Stockholders' equity 538,607$ 393,914$ 208,420$ 578,865$ 647,700$
Year Ended December 31,
32