Thrifty Car Rental 2010 Annual Report Download - page 60
Download and view the complete annual report
Please find page 60 of the 2010 Thrifty Car Rental annual report below. You can navigate through the pages in the report by either clicking on the pages listed below, or by using the keyword search tool below to find specific information within the annual report.-
 1
1 -
2
-
3
-
4
-
5
-
6
-
7
-
8
-
9
-
10
-
11
-
12
-
13
-
14
-
15
-
16
-
17
-
18
-
19
-
20
-
21
-
22
-
23
-
24
-
25
-
26
-
27
-
28
-
29
-
30
-
31
-
32
-
33
-
34
-
35
-
36
-
37
-
38
-
39
-
40
-
41
-
42
-
43
-
44
-
45
-
46
-
47
-
48
-
49
-
 50
50 -
 51
51 -
 52
52 -
 53
53 -
 54
54 -
 55
55 -
 56
56 -
 57
57 -
 58
58 -
 59
59 -
 60
60 -
 61
61 -
 62
62 -
 63
63 -
 64
64 -
 65
65 -
 66
66 -
 67
67 -
 68
68 -
 69
69 -
 70
70 -
71
-
72
-
73
-
74
-
75
-
76
-
77
-
78
-
79
-
80
-
81
-
82
-
83
-
84
-
85
-
86
-
87
-
88
-
89
-
90
-
91
-
92
-
93
-
94
-
95
-
96
-
97
-
98
-
99
-
100
-
101
-
102
-
103
-
104
-
105
-
106
-
107
-
108
-
109
-
110
-
111
-
112
-
113
-
114
-
115
-
116
-
117
 |
 |

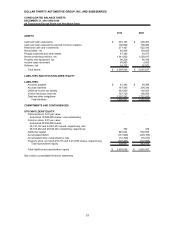
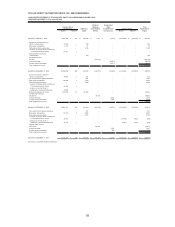
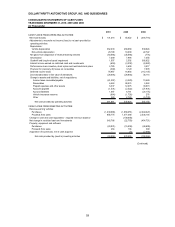
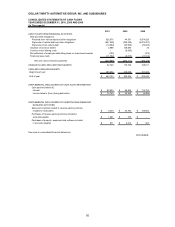
DOLLAR THRIFTY AUTOMOTIVE GROUP, INC. AND SUBSIDIARIES
CONSOLIDATED STATEMENTS OF CASH FLOWS
Y
EAR ENDED DECEMBER 31, 2010, 2009 AND 2008
(In Thousands)
2010 2009 2008
CASH FLOWS FROM OPERATING ACTIVITIES:
Net income (loss) 131,216$ 45,022$ (346,718)$
Adjustments to reconcile net income (loss) to net cash provided by
operating activities:
Depreciation:
Vehicle depreciation 362,233 460,660 539,024
Non-vehicle depreciation 20,190 19,200 22,722
Net gains from disposition of revenue-earning vehicles (63,084) (35,086) (774)
Amortization 7,290 7,994 7,355
Goodwill and long-lived asset impairment 1,057 2,592 366,822
Interest income earned on restricted cash and investments (653) (3,202) (8,922)
Performance share incentive, stock option and restricted stock plans 4,785 4,698 3,917
Provision for (recovery of) losses on receivables (399) 3,129 7,878
Deferred income taxes 76,957 16,854 (112,107)
(Increase)/decrease in fair value of derivatives (28,694) (28,848) 36,114
Change in assets and liabilities, net of acquisitions:
Income taxes receivable/payable (61,357) (3,220) 10,489
Receivables 6,442 28,574 4,942
Prepaid expenses and other assets 6,337 12,275 33,973
Accounts payable (1,531) (2,522) (27,931)
Accrued liabilities 1,687 6,761 (24,175)
Vehicle insurance reserves (864) (1,726) 276
Other 329 2,769 (5,730)
Net cash provided by operating activities 461,941 535,924 507,155
CASH FLOWS FROM INVESTING ACTIVITIES:
Revenue-earning vehicles:
Purchases (1,239,088) (1,060,251) (2,249,227)
Proceeds from sales 856,775 1,477,368 2,536,146
Change in cash and cash equivalents - required minimum balance - (100,000) -
Net change in restricted cash and investments 345,786 (22,750) (454,721)
Property, equipment and software:
Purchases (23,031) (15,508) (28,895)
Proceeds from sales 464 104 399
Acquisition of businesses, net of cash acquired - (8) (2,068)
Net cash provided by (used in) investing activities (59,094) 278,955 (198,366)
(Continued)
59