Thrifty Car Rental 2006 Annual Report Download - page 78
Download and view the complete annual report
Please find page 78 of the 2006 Thrifty Car Rental annual report below. You can navigate through the pages in the report by either clicking on the pages listed below, or by using the keyword search tool below to find specific information within the annual report.-
 1
1 -
2
-
3
-
4
-
5
-
6
-
7
-
8
-
9
-
10
-
11
-
12
-
13
-
14
-
15
-
16
-
17
-
18
-
19
-
20
-
21
-
22
-
23
-
24
-
25
-
26
-
27
-
28
-
29
-
30
-
31
-
32
-
33
-
34
-
35
-
36
-
37
-
38
-
39
-
40
-
41
-
42
-
43
-
44
-
45
-
46
-
47
-
48
-
49
-
50
-
51
-
52
-
53
-
54
-
55
-
56
-
57
-
58
-
59
-
60
-
61
-
62
-
63
-
64
-
65
-
66
-
67
-
 68
68 -
 69
69 -
 70
70 -
 71
71 -
 72
72 -
 73
73 -
 74
74 -
 75
75 -
 76
76 -
 77
77 -
 78
78 -
 79
79 -
 80
80 -
 81
81 -
 82
82 -
 83
83 -
 84
84 -
 85
85 -
 86
86 -
 87
87 -
 88
88 -
89
-
90
-
91
-
92
-
93
-
94
-
95
-
96
-
97
-
98
-
99
-
100
-
101
-
102
-
103
-
104
-
105
-
106
-
107
-
108
-
109
-
110
-
111
-
112
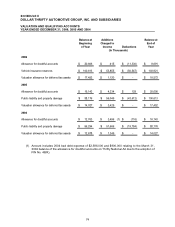
 |
 |

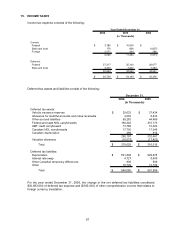
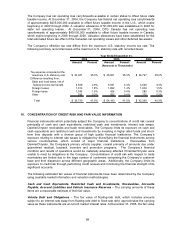
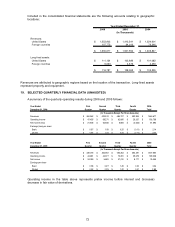
Included in the consolidated financial statements are the following amounts relating to geographic
locations:
Year Ended December 31,
2006 2005 2004
(In Thousands)
Revenues:
United States 1,552,902$ 1,413,541$ 1,324,601$
Foreign countries 107,775 94,013 79,246
1,660,677$ 1,507,554$ 1,403,847$
Long-lived assets:
United States 111,134$ 103,686$ 101,082$
Foreign countries 5,653 4,376 4,253
116,787$ 108,062$ 105,335$
Revenues are attributed to geographic regions based on the location of the transaction. Long-lived assets
represent property and equipment.
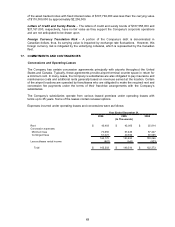
19. SELECTED QUARTERLY FINANCIAL DATA (UNAUDITED)
A summary of the quarterly operating results during 2006 and 2005 follows:
Year Ended First Second Third Fourth 2006
December 31, 2006 Quarter Quarter Quarter Quarter Total
Revenues 360,562$ 422,574$ 484,707$ 392,834$ 1,660,677$
Operating income 47,455$ 58,271$ 62,695$ 25,337$ 193,758$
Net income (loss) 21,806$ 26,655$ 5,884$ (2,653)$ 51,692$
Earnings (loss) per share
Basic 0.87$ 1.09$ 0.25$ (0.11)$ 2.14$
Diluted 0.84$ 1.04$ 0.24$ (0.11)$ 2.04$
Year Ended First Second Third Fourth 2005
December 31, 2005 Quarter Quarter Quarter Quarter Total
Revenues 339,318$ 363,492$ 452,363$ 352,381$ 1,507,554$
Operating income 43,681$ 43,377$ 72,291$ 29,679$ 189,028$
Net income 24,085$ 6,689$ 37,410$ 8,171$ 76,355$
Earnings per share
Basic 0.96$ 0.27$ 1.49$ 0.32$ 3.04$
Diluted 0.92$ 0.25$ 1.42$ 0.31$ 2.89$
(In Thousands Except Per Share Amounts)
(In Thousands Except Per Share Amounts)
Operating income in the table above represents pretax income before interest and (increase)
decrease in fair value of derivatives.
72