Thrifty Car Rental 2006 Annual Report Download - page 35
Download and view the complete annual report
Please find page 35 of the 2006 Thrifty Car Rental annual report below. You can navigate through the pages in the report by either clicking on the pages listed below, or by using the keyword search tool below to find specific information within the annual report.-
 1
1 -
2
-
3
-
4
-
5
-
6
-
7
-
8
-
9
-
10
-
11
-
12
-
13
-
14
-
15
-
16
-
17
-
18
-
19
-
20
-
21
-
22
-
23
-
24
-
 25
25 -
 26
26 -
 27
27 -
 28
28 -
 29
29 -
 30
30 -
 31
31 -
 32
32 -
 33
33 -
 34
34 -
 35
35 -
 36
36 -
 37
37 -
 38
38 -
 39
39 -
 40
40 -
 41
41 -
 42
42 -
 43
43 -
 44
44 -
 45
45 -
46
-
47
-
48
-
49
-
50
-
51
-
52
-
53
-
54
-
55
-
56
-
57
-
58
-
59
-
60
-
61
-
62
-
63
-
64
-
65
-
66
-
67
-
68
-
69
-
70
-
71
-
72
-
73
-
74
-
75
-
76
-
77
-
78
-
79
-
80
-
81
-
82
-
83
-
84
-
85
-
86
-
87
-
88
-
89
-
90
-
91
-
92
-
93
-
94
-
95
-
96
-
97
-
98
-
99
-
100
-
101
-
102
-
103
-
104
-
105
-
106
-
107
-
108
-
109
-
110
-
111
-
112
 |
 |

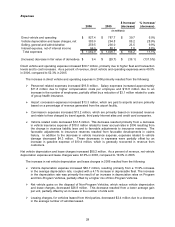
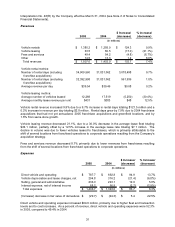
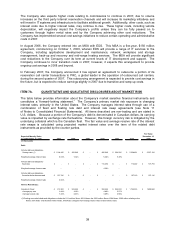
Expenses
$ Increase/ % Increase/
2006 2005 (decrease) (decrease)
Direct vehicle and operating 827.4$ 787.7$ 39.7$ 5.0%
Vehicle depreciation and lease charges, net 380.0 294.8 85.2 28.9%
Selling, general and administrative 259.5 236.0 23.5 9.9%
Interest expense, net of interest income 96.0 88.2 7.8 8.8%
Total expenses 1,562.9$ 1,406.7$ 156.2$ 11.1%
(Increase) decrease in fair value of derivatives 9.4$ (29.7)$ (39.1)$ (131.5%)
(in millions)
Direct vehicle and operating expense increased $39.7 million, primarily due to higher fleet and transaction
levels and to cost increases. As a percent of revenue, direct vehicle and operating expenses were 49.8%
in 2006, compared to 52.3% in 2005.
The increase in direct vehicle and operating expense in 2006 primarily resulted from the following:
¾ Personnel related expenses increased $19.8 million. Salary expenses increased approximately
$11.8 million due to higher compensation costs per employee and $10.8 million due to an
increase in the number of employees, partially offset by a reduction of $3.1 million related to costs
of group health insurance.
¾ Airport concession expenses increased $13.3 million, which are paid to airports and are primarily
based on a percentage of revenue generated from the airport facility.
¾ Commission expenses increased $13.2 million, which are primarily based on increased revenue
and relate to fees charged by travel agents, third party Internet sites and credit card companies.
¾ Vehicle related costs decreased $12.5 million. This decrease resulted primarily from a decrease
in vehicle insurance expense of $18.0 million related to lower accrual rates in 2006 resulting from
the change in vicarious liability laws and to favorable adjustments to insurance reserves. The
favorable adjustments to insurance reserves resulted from favorable developments in claims
history. In addition to the decrease in vehicle insurance expense, expenses related to vehicle
damage decreased $4.3 million. These decreases in expenses were partially offset by an
increase in gasoline expense of $10.4 million, which is generally recovered in revenue from
customers.
Net vehicle depreciation and lease charges increased $85.2 million. As a percent of revenue, net vehicle
depreciation expense and lease charges were 22.9% in 2006, compared to 19.6% in 2005.
The increase in net vehicle depreciation and lease charges in 2006 resulted from the following:
¾ Vehicle depreciation expense increased $60.7 million, resulting primarily from a 13.9% increase
in the average depreciation rate, coupled with a 4.1% increase in depreciable fleet. The increase
in the depreciation rate was primarily the result of an increase in depreciation rates on Program
and Non-Program Vehicles, partially offset by a higher mix of Non-Program Vehicles.
¾ Net vehicle gains on the disposal of Non-Program Vehicles, which reduce vehicle depreciation
and lease charges, decreased $26.9 million. This decrease resulted from a lower average gain
per unit, partially offset by an increase in the number of units sold.
¾ Leasing charges, for vehicles leased from third parties, decreased $2.4 million due to a decrease
in the average number of vehicles leased.
29