Thrifty Car Rental 2006 Annual Report Download - page 37
Download and view the complete annual report
Please find page 37 of the 2006 Thrifty Car Rental annual report below. You can navigate through the pages in the report by either clicking on the pages listed below, or by using the keyword search tool below to find specific information within the annual report.-
 1
1 -
2
-
3
-
4
-
5
-
6
-
7
-
8
-
9
-
10
-
11
-
12
-
13
-
14
-
15
-
16
-
17
-
18
-
19
-
20
-
21
-
22
-
23
-
24
-
25
-
26
-
 27
27 -
 28
28 -
 29
29 -
 30
30 -
 31
31 -
 32
32 -
 33
33 -
 34
34 -
 35
35 -
 36
36 -
 37
37 -
 38
38 -
 39
39 -
 40
40 -
 41
41 -
 42
42 -
 43
43 -
 44
44 -
 45
45 -
 46
46 -
 47
47 -
48
-
49
-
50
-
51
-
52
-
53
-
54
-
55
-
56
-
57
-
58
-
59
-
60
-
61
-
62
-
63
-
64
-
65
-
66
-
67
-
68
-
69
-
70
-
71
-
72
-
73
-
74
-
75
-
76
-
77
-
78
-
79
-
80
-
81
-
82
-
83
-
84
-
85
-
86
-
87
-
88
-
89
-
90
-
91
-
92
-
93
-
94
-
95
-
96
-
97
-
98
-
99
-
100
-
101
-
102
-
103
-
104
-
105
-
106
-
107
-
108
-
109
-
110
-
111
-
112
 |
 |

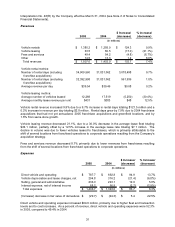
Interpretation No. 46(R) by the Company effective March 31, 2004 (see Note 2 of Notes to Consolidated
Financial Statements).
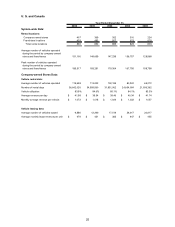
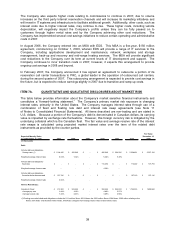
Revenues
$ Increase/ % Increase/
2005 2004 (decrease) (decrease)
Vehicle rentals 1,380.2$ 1,255.9$ 124.3$ 9.9%
Vehicle leasing 63.5 80.5 (17.0) (21.1%)
Fees and services 49.4 54.2 (4.8) (8.7%)
Other 14.5 13.3 1.2 8.6%
Total revenues 1,507.6$ 1,403.9$ 103.7$ 7.4%
Vehicle rental metrics:
Number of rental days (including 34,909,560 31,831,062 3,078,498 9.7%
franchise acquisitions)
Number of rental days (excluding 32,392,998 31,831,062 561,936 1.8%
franchise acquisitions)
Average revenue per day $39.54 $39.46 $0.08 0.2%
Vehicle leasing metrics:
Average number of vehicles leased 12,269 17,519 (5,250) (30.0%)
Average monthly lease revenue per unit $431 $383 $48 12.5%
(in millions)
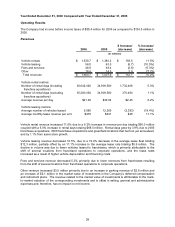
Vehicle rental revenue increased 9.9% due to a 9.7% increase in rental days totaling $121.5 million and a
0.2% increase in revenue per day totaling $2.8 million. Rental days grew by 7.9% due to 2004 franchisee
acquisitions that had not yet annualized, 2005 franchisee acquisitions and greenfield locations, and by
1.8% from same store growth.
Vehicle leasing revenue decreased 21.1%, due to a 30.0% decrease in the average lease fleet totaling
$24.1 million, partially offset by a 12.5% increase in the average lease rate totaling $7.1 million. The
decline in volume was due to fewer vehicles leased to franchisees, which is primarily attributable to the
shift of several locations from franchised operations to corporate operations resulting from the Company’s
acquisition strategy.
Fees and services revenue decreased 8.7% primarily due to lower revenues from franchisees resulting
from the shift of several locations from franchised operations to corporate operations.
Expenses
$ Increase/ % Increase/
2005 2004 (decrease) (decrease)
Direct vehicle and operating 787.7$ 692.8$ 94.9$ 13.7%
Vehicle depreciation and lease charges, net 294.8 316.2 (21.4) (6.8%)
Selling, general and administrative 236.0 223.1 12.9 5.8%
Interest expense, net of interest income 88.2 90.9 (2.7) (2.9%)
Total expenses 1,406.7$ 1,323.0$ 83.7$ 6.3%
(Increase) decrease in fair value of derivatives (29.7)$ (24.3)$ 5.4$ 22.5%
(in millions)
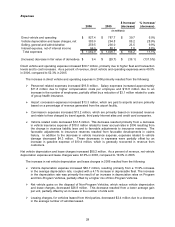
Direct vehicle and operating expense increased $94.9 million, primarily due to higher fleet and transaction
levels and to cost increases. As a percent of revenue, direct vehicle and operating expenses were 52.3%
in 2005, compared to 49.4% in 2004.
31