Thrifty Car Rental 2006 Annual Report Download - page 38
Download and view the complete annual report
Please find page 38 of the 2006 Thrifty Car Rental annual report below. You can navigate through the pages in the report by either clicking on the pages listed below, or by using the keyword search tool below to find specific information within the annual report.-
 1
1 -
2
-
3
-
4
-
5
-
6
-
7
-
8
-
9
-
10
-
11
-
12
-
13
-
14
-
15
-
16
-
17
-
18
-
19
-
20
-
21
-
22
-
23
-
24
-
25
-
26
-
27
-
 28
28 -
 29
29 -
 30
30 -
 31
31 -
 32
32 -
 33
33 -
 34
34 -
 35
35 -
 36
36 -
 37
37 -
 38
38 -
 39
39 -
 40
40 -
 41
41 -
 42
42 -
 43
43 -
 44
44 -
 45
45 -
 46
46 -
 47
47 -
 48
48 -
49
-
50
-
51
-
52
-
53
-
54
-
55
-
56
-
57
-
58
-
59
-
60
-
61
-
62
-
63
-
64
-
65
-
66
-
67
-
68
-
69
-
70
-
71
-
72
-
73
-
74
-
75
-
76
-
77
-
78
-
79
-
80
-
81
-
82
-
83
-
84
-
85
-
86
-
87
-
88
-
89
-
90
-
91
-
92
-
93
-
94
-
95
-
96
-
97
-
98
-
99
-
100
-
101
-
102
-
103
-
104
-
105
-
106
-
107
-
108
-
109
-
110
-
111
-
112
 |
 |
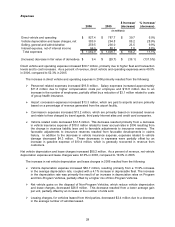
The increase in direct vehicle and operating expense in 2005 resulted from the following:
¾ Personnel related expenses increased $30.2 million. During the year, salary expenses increased
approximately $18.9 million due to an increase in the number of employees, $7.0 million from
merit increases and $3.8 million related to group health insurance increases due to rising
insurance costs and increased employment.
¾ Vehicle related costs increased $22.1 million. This increase resulted primarily from increases in
vehicle damage expense of $9.7 million and gas expense of $9.4 million. All other fleet related
expenses increased $7.6 million and were partially offset by a decrease in vehicle insurance
expense of $4.6 million, primarily related to a decrease in insurance reserves. The decrease in
insurance reserves was a result of favorable developments in claims history and to a change in
the vicarious liability law, which imposed liability on vehicle owners for acts by vehicle drivers.
The federal “Safe, Accountable, Flexible, Efficient Transportation Equity Act: A Legacy for Users”,
referred to as the “Highway Bill”, was signed into law on August 10, 2005, and removes unlimited
vicarious liability for vehicle rental and leasing companies, limiting the Company’s exposure to
state minimum financial responsibility amounts.
¾ Facility and airport concession expenses increased $22.2 million. This increase resulted primarily
from increases in concession fees, which are paid primarily to airports and are based on a
percentage of revenue generated from the airport facility, of $11.2 million, rent expense of $5.5
million, building repairs and maintenance expense of $2.5 and $3.0 million from all other facility
expenses including expenses such as utilities and real estate taxes.
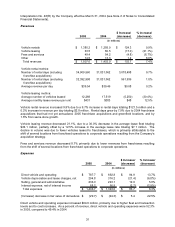
Net vehicle depreciation and lease charges decreased $21.4 million. As a percent of revenue, net vehicle
depreciation expense and lease charges were 19.6% in 2005, compared to 22.5% in 2004.
The decrease in net vehicle depreciation and lease charges in 2005 resulted from the following:
¾ Net vehicle gains on the disposal of Non-Program Vehicles, which reduce vehicle depreciation
and lease charges, increased $18.4 million. This increase resulted from an increase in the
number of units sold as the Company took advantage of the strong used car market, and an
increase in the average gain per unit.
¾ Leasing charges, for vehicles leased from third parties, decreased $7.4 million due to a decrease
in the average number of vehicles leased.
¾ Vehicle depreciation expense increased $4.4 million, resulting primarily from a 6.2% increase in
depreciable fleet, partially offset by a 4.6% decrease in the average depreciation rate. The
decrease in depreciation rate was primarily the result of a shift in the fleet to lower cost units
including a higher proportion of Non-Program Vehicles, which was partially offset by an increase
in depreciation rates on Program Vehicles.
Selling, general and administrative expenses for 2005 increased $12.9 million, resulting from a $12.2
million increase in general and administrative expenses and a $0.7 million increase in sales and
marketing expenses. As a percent of revenue, selling, general and administrative expenses were 15.6%
in 2005, compared to 15.9% in 2004.
The increase in selling, general and administrative expenses in 2005 resulted from the following:
¾ Personnel related expenses increased $8.6 million. Salary expense increased $4.9 million
resulting primarily from merit increases. Incentive compensation increased $2.6 million due to
increased pretax income in 2005. Group health insurance increased $0.9 million, related to rising
insurance costs.
¾ Other general and administrative expenses increased $3.6 million primarily in the categories of
depreciation and amortization expense, communications expense, computer and networking
expenses and bad debt expense.
32