Thrifty Car Rental 2006 Annual Report Download - page 45
Download and view the complete annual report
Please find page 45 of the 2006 Thrifty Car Rental annual report below. You can navigate through the pages in the report by either clicking on the pages listed below, or by using the keyword search tool below to find specific information within the annual report.-
 1
1 -
2
-
3
-
4
-
5
-
6
-
7
-
8
-
9
-
10
-
11
-
12
-
13
-
14
-
15
-
16
-
17
-
18
-
19
-
20
-
21
-
22
-
23
-
24
-
25
-
26
-
27
-
28
-
29
-
30
-
31
-
32
-
33
-
34
-
 35
35 -
 36
36 -
 37
37 -
 38
38 -
 39
39 -
 40
40 -
 41
41 -
 42
42 -
 43
43 -
 44
44 -
 45
45 -
 46
46 -
 47
47 -
 48
48 -
 49
49 -
 50
50 -
 51
51 -
 52
52 -
 53
53 -
 54
54 -
 55
55 -
56
-
57
-
58
-
59
-
60
-
61
-
62
-
63
-
64
-
65
-
66
-
67
-
68
-
69
-
70
-
71
-
72
-
73
-
74
-
75
-
76
-
77
-
78
-
79
-
80
-
81
-
82
-
83
-
84
-
85
-
86
-
87
-
88
-
89
-
90
-
91
-
92
-
93
-
94
-
95
-
96
-
97
-
98
-
99
-
100
-
101
-
102
-
103
-
104
-
105
-
106
-
107
-
108
-
109
-
110
-
111
-
112
 |
 |

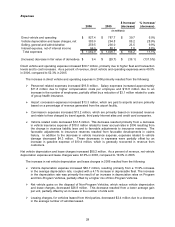
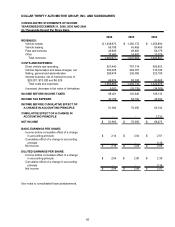
The Company also expects higher costs relating to commissions to continue in 2007, due to volume
increases on the third party Internet reservation channels and will increase its marketing initiatives and
will invest in IT systems and infrastructure to facilitate additional growth. Additionally, other costs, such as
interest costs due to higher interest rates, may continue to rise. These higher costs, including vehicle
depreciation, will negatively impact the Company’s profits unless they can be fully passed on to
customers through higher rental rates and by the Company achieving other cost reductions. The
Company has implemented several cost savings initiatives to reduce certain operating and administrative
costs in 2007.
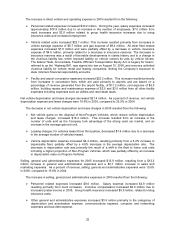
In August 2006, the Company entered into an MSA with EDS. This MSA is a five-year, $150 million
agreement, commencing on October 1, 2006, wherein EDS will provide a range of IT services to the
Company, including applications development and maintenance, network, workplace and storage
management, back-up and recovery and mid-range hosting services. The MSA will provide significant
cost reductions to the Company over its term at current levels of IT development and support. The
Company continues to incur transition costs in 2007; however, it expects this arrangement to provide
ongoing cost savings in 2008 and beyond.
In February 2007, the Company announced it has signed an agreement to outsource a portion of its
reservation call center transactions to PRC, a global leader in the operation of outsourced call centers,
during the second quarter of 2007. This outsourcing arrangement is expected to provide cost savings in
the future, but is expected to reduce earnings slightly in 2007 due to transition and ramp up costs.
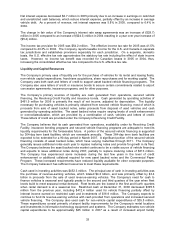
ITEM 7A. QUANTITATIVE AND QUALITATIVE DISCLOSURES ABOUT MARKET RISK
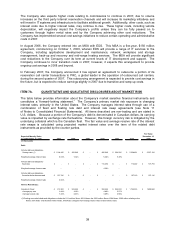
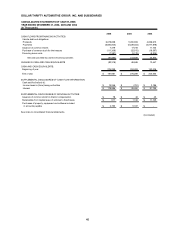
The table below provides information about the Company’s market sensitive financial instruments and
constitutes a “forward-looking statement.” The Company’s primary market risk exposure is changing
interest rates, primarily in the United States. The Company manages interest rates through use of a
combination of fixed and floating rate debt and interest rate swap agreements (see Note 11
of Notes to Consolidated Financial Statements). All items described are non-trading and are stated in
U.S. dollars. Because a portion of the Company’s debt is denominated in Canadian dollars, its carrying
value is impacted by exchange rate fluctuations. However, this foreign currency risk is mitigated by the
underlying collateral which is the Canadian fleet. The fair value and average receive rate of the interest
rate swaps is calculated using projected market interest rates over the term of the related debt
instruments as provided by the counter parties.
Fair Value
Expected Maturity Dates December 31,
as of December 31, 2006 2007 2008 2009 2010 2011 Total 2006
(in thousands)
Debt:
Vehicle debt and obligations-
floating rates (1) 1,138,491$ 500,000$ -$ 390,000$ 500,000$ 2,528,491$ 2,527,154$
Weighted average interest rates 6.02% 5.34% - 5.26% 5.39%
Vehicle debt and obligations-
fixed rates -$ -$ -$ 110,000$ -$ 110,000$ 107,794$
Weighted average interest rates - - - 4.59% -
Vehicle debt and obligations-
Canadian dollar denominated 107,130$ -$ -$ -$ -$ 107,130$ 107,130$
Weighted average interest rates 4.63% - - - -
Interest Rate Swaps:
Variable to Fixed 312,500$ 500,000$ -$ 390,000$ 500,000$ 1,702,500$ 1,690,960$
Average pay rate 3.64% 4.20% - 4.89% 5.27%
Average receive rate 5.25% 4.87% - 4.89% 4.98%
(1) Floating rate vehicle debt and obligations include the $313 million Series 2003 Notes, the $500 million Series 2004 Notes, $290 million relating to the
Series 2005 Notes and the $600 million Series 2006 Notes swapped from floating interest rates to fixed interest rates.
39