Thrifty Car Rental 2006 Annual Report Download - page 36
Download and view the complete annual report
Please find page 36 of the 2006 Thrifty Car Rental annual report below. You can navigate through the pages in the report by either clicking on the pages listed below, or by using the keyword search tool below to find specific information within the annual report.-
 1
1 -
2
-
3
-
4
-
5
-
6
-
7
-
8
-
9
-
10
-
11
-
12
-
13
-
14
-
15
-
16
-
17
-
18
-
19
-
20
-
21
-
22
-
23
-
24
-
25
-
 26
26 -
 27
27 -
 28
28 -
 29
29 -
 30
30 -
 31
31 -
 32
32 -
 33
33 -
 34
34 -
 35
35 -
 36
36 -
 37
37 -
 38
38 -
 39
39 -
 40
40 -
 41
41 -
 42
42 -
 43
43 -
 44
44 -
 45
45 -
 46
46 -
47
-
48
-
49
-
50
-
51
-
52
-
53
-
54
-
55
-
56
-
57
-
58
-
59
-
60
-
61
-
62
-
63
-
64
-
65
-
66
-
67
-
68
-
69
-
70
-
71
-
72
-
73
-
74
-
75
-
76
-
77
-
78
-
79
-
80
-
81
-
82
-
83
-
84
-
85
-
86
-
87
-
88
-
89
-
90
-
91
-
92
-
93
-
94
-
95
-
96
-
97
-
98
-
99
-
100
-
101
-
102
-
103
-
104
-
105
-
106
-
107
-
108
-
109
-
110
-
111
-
112
 |
 |
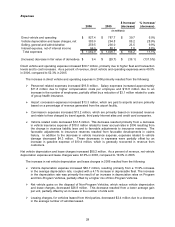
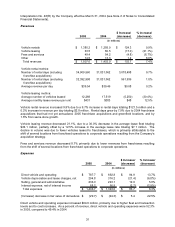
Selling, general and administrative expenses for 2006 increased $23.5 million, resulting from a $20.2
million increase in general and administrative expenses and a $3.3 million increase in sales and
marketing expenses. As a percent of revenue, selling, general and administrative expenses were 15.6%
in 2006 and 2005.
The increase in selling, general and administrative expenses in 2006 resulted from the following:
¾ Information technology related expenses increased $10.6 million due to the outsourcing of
information technology services to EDS. These costs include base contract fees of $7.7 million
and an increase in contract labor of $2.9 million.
¾ Transition costs relating to the outsourcing of information technology services were $6.9 million,
including salary related expenses.
¾ Sales and marketing expense increased $3.3 million due primarily to increased Internet-related
spending and other marketing related costs.
¾ Professional fees increased $3.2 million due to costs of $1.9 million related to a review of
strategic alternatives and $1.3 million related to higher consulting costs related to review of
outsourcing alternatives.
¾ Separation costs relating to the elimination of certain positions from the organizational structure
were $2.4 million.
¾ The market value of investments in the Company’s deferred compensation and retirement plans
increased $2.1 million, which is offset in other revenue and, therefore, did not impact net income.
¾ Personnel related expenses decreased $1.1 million due primarily to lower personnel costs of
approximately $6.2 million, which was primarily related to IT employees outsourced in October
2006 and a $1.5 million reduction in group health insurance. These reductions in personnel
related costs were partially offset by a $6.6 million increase in performance share expense. The
increase in performance share expense included $2.2 million related to a change in estimate for
the final calculation of the vested 2003 performance share awards paid in 2006, $2.9 million for
higher costs related to the 2006 performance share awards and $1.5 million to reflect current
performance estimates.
Net interest expense increased $7.8 million in 2006 primarily due to higher average vehicle debt and
higher interest rates, partially offset by higher interest rates on cash invested and to an increase in the
rate received on interest reimbursements relating to vehicle programs. As a percent of revenue, net
interest expense was 5.8% in 2006 and 2005.
The change in fair value of the Company’s interest rate swap agreements was a decrease of $9.4 million
in 2006 compared to an increase of ($29.7) million in 2005 resulting in a year over year decrease of $39.1
million.
The income tax provision for 2006 was $36.7 million. The effective income tax rate was 41.5% for 2006
and 2005. The Company reports taxable income for the U.S. and Canada in separate tax jurisdictions
and establishes provisions separately for each jurisdiction. On a separate, domestic basis, the U.S.
effective tax rate approximates the statutory tax rate including the effect of state income taxes. However,
no income tax benefit was recorded for Canadian losses in 2006 or 2005, thus, increasing the
consolidated effective tax rate compared to the U.S. effective tax rate.
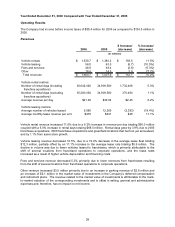
Year Ended December 31, 2005 Compared with Year Ended December 31, 2004
Operating Results
The Company had income before income taxes of $130.5 million for 2005 as compared to income before
income taxes and cumulative effect of a change in accounting principle of $105.1 million in 2004. The
cumulative effect of the change in accounting principle in 2004 was $3.7 million. This change in
accounting principle related to the adoption of Financial Accounting Standards Board (“FASB”)
30