Thrifty Car Rental 2006 Annual Report Download - page 30
Download and view the complete annual report
Please find page 30 of the 2006 Thrifty Car Rental annual report below. You can navigate through the pages in the report by either clicking on the pages listed below, or by using the keyword search tool below to find specific information within the annual report.-
 1
1 -
2
-
3
-
4
-
5
-
6
-
7
-
8
-
9
-
10
-
11
-
12
-
13
-
14
-
15
-
16
-
17
-
18
-
19
-
 20
20 -
 21
21 -
 22
22 -
 23
23 -
 24
24 -
 25
25 -
 26
26 -
 27
27 -
 28
28 -
 29
29 -
 30
30 -
 31
31 -
 32
32 -
 33
33 -
 34
34 -
 35
35 -
 36
36 -
 37
37 -
 38
38 -
 39
39 -
 40
40 -
41
-
42
-
43
-
44
-
45
-
46
-
47
-
48
-
49
-
50
-
51
-
52
-
53
-
54
-
55
-
56
-
57
-
58
-
59
-
60
-
61
-
62
-
63
-
64
-
65
-
66
-
67
-
68
-
69
-
70
-
71
-
72
-
73
-
74
-
75
-
76
-
77
-
78
-
79
-
80
-
81
-
82
-
83
-
84
-
85
-
86
-
87
-
88
-
89
-
90
-
91
-
92
-
93
-
94
-
95
-
96
-
97
-
98
-
99
-
100
-
101
-
102
-
103
-
104
-
105
-
106
-
107
-
108
-
109
-
110
-
111
-
112
 |
 |

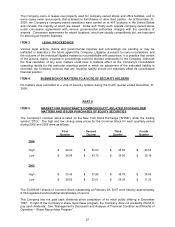
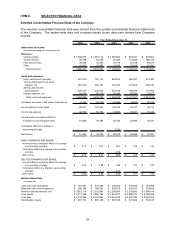
ITEM 6. SELECTED FINANCIAL DATA
Selected Consolidated Financial Data of the Company
The selected consolidated financial data was derived from the audited consolidated financial statements
of the Company. The system-wide data and company-owned stores data were derived from Company
records.
2006 2005 2004 2003 2002
Statements of Income:
(in thousands except per share amounts)
Revenues:
Vehicle rentals 1,538,673$ 1,380,172$ 1,255,890$ 994,647$ 878,802$
Vehicle leasing 56,798 63,465 80,456 144,368 168,792
Fees and services 46,806 49,450 54,176 54,149 56,237
Other 18,400 14,467 13,325 15,248 10,781
Total revenues 1,660,677 1,507,554 1,403,847 1,208,412 1,114,612
Costs and expenses:
Direct vehicle and operating 827,440 787,714 692,803 484,787 373,392
Vehicle depreciation and lease
charges, net 380,005 294,757 316,199 407,509 392,732
Selling, general and
administrative 259,474 236,055 223,109 189,575 177,562
Interest expense, net 95,974 88,208 90,868 89,296 93,427
Total costs and expenses 1,562,893 1,406,734 1,322,979 1,171,167 1,037,113
(Increase) decrease in fair value of derivatives 9,363 (29,725) (24,265) (8,902) 30,725
Income before income taxes 88,421 130,545 105,133 46,147 46,774
Income tax expense 36,729 54,190 42,390 20,451 16,443
Income before cumulative effect of
a change in accounting principle 51,692 76,355 62,743 25,696 30,331
Cumulative effect of a change in
accounting principle - - 3,730 - -
Net income 51,692$ 76,355$ 66,473$ 25,696$ 30,331
$
BASIC EARNINGS PER SHARE:
Income before cumulative effect of a change
in accounting principle 2.14$ 3.04$ 2.51$ 1.05$ 1.25$
Cumulative effect of a change in accounting
principle - - 0.15 - -
Net income 2.14$ 3.04$ 2.66$ 1.05$ 1.25$
DILUTED EARNINGS PER SHARE:
Income before cumulative effect of a change
in accounting principle 2.04$ 2.89$ 2.39$ 1.01$ 1.22$
Cumulative effect of a change in accounting
principle - - 0.14 - -
Net income 2.04$ 2.89$ 2.53$ 1.01$ 1.22$
Balance Sheet Data:
(in thousands)
Cash and cash equivalents 191,981$ 274,299$ 204,453$ 192,006$ 143,485$
Restricted cash and investments 389,794$ 785,290$ 455,215$ 536,547$ 334,849$
Revenue-earning vehicles, net 2,623,719$ 2,202,890$ 2,256,905$ 2,126,862$ 1,989,919$
Total assets 4,011,498$ 3,986,784$ 3,604,977$ 3,396,270$ 3,096,029$
Total debt 2,744,284$ 2,724,952$ 2,500,426$ 2,442,162$ 2,224,303$
Stockholders' equity 647,700$ 690,428$ 608,743$ 537,849$ 503,447$
Year Ended December 31,
24