Thrifty Car Rental 2006 Annual Report Download - page 51
Download and view the complete annual report
Please find page 51 of the 2006 Thrifty Car Rental annual report below. You can navigate through the pages in the report by either clicking on the pages listed below, or by using the keyword search tool below to find specific information within the annual report.-
 1
1 -
2
-
3
-
4
-
5
-
6
-
7
-
8
-
9
-
10
-
11
-
12
-
13
-
14
-
15
-
16
-
17
-
18
-
19
-
20
-
21
-
22
-
23
-
24
-
25
-
26
-
27
-
28
-
29
-
30
-
31
-
32
-
33
-
34
-
35
-
36
-
37
-
38
-
39
-
40
-
 41
41 -
 42
42 -
 43
43 -
 44
44 -
 45
45 -
 46
46 -
 47
47 -
 48
48 -
 49
49 -
 50
50 -
 51
51 -
 52
52 -
 53
53 -
 54
54 -
 55
55 -
 56
56 -
 57
57 -
 58
58 -
 59
59 -
 60
60 -
 61
61 -
62
-
63
-
64
-
65
-
66
-
67
-
68
-
69
-
70
-
71
-
72
-
73
-
74
-
75
-
76
-
77
-
78
-
79
-
80
-
81
-
82
-
83
-
84
-
85
-
86
-
87
-
88
-
89
-
90
-
91
-
92
-
93
-
94
-
95
-
96
-
97
-
98
-
99
-
100
-
101
-
102
-
103
-
104
-
105
-
106
-
107
-
108
-
109
-
110
-
111
-
112
 |
 |

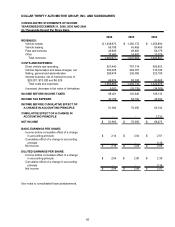
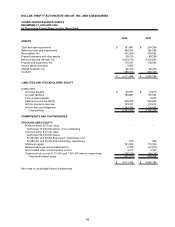
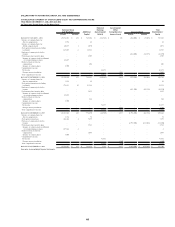
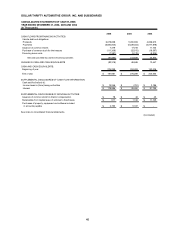
DOLLAR THRIFTY AUTOMOTIVE GROUP, INC. AND SUBSIDIARIES
CONSOLIDATED STATEMENTS OF CASH FLOWS
Y
EAR ENDED DECEMBER 31, 2006, 2005 AND 2004
(In Thousands)
2006 2005 2004
CASH FLOWS FROM OPERATING ACTIVITIES:
Net income 51,692$ 76,355$ 66,473$
Adjustments to reconcile net income to net cash provided by
operating activities:
Depreciation:
Vehicle depreciation 387,350 326,632 322,265
Non-vehicle depreciation 20,343 20,709 18,021
Net gains from disposition of revenue-earning vehicles (14,491) (41,431) (22,987)
Amortization 6,410 6,088 5,547
Interest income earned on restricted cash and investments (16,896) (11,045) (4,333)
Performance share incentive and restricted stock plan 11,130 4,543 4,311
Net losses from sale of property and equipment 63 51 246
Provision for losses on receivables 415 4,334 2,596
Deferred income taxes 30,693 42,940 43,961
(Increase) decrease in fair value of derivatives 9,363 (29,725) (24,265)
Change in assets and liabilities, net of acquisitions:
Income taxes payable/receivable (10,792) 11,964 (3,757)
Receivables (29,927) (11,522) (23,139)
Prepaid expenses and other assets 6,546 6,068 (11,971)
Accounts payable (8,930) 8,320 14,594
Accrued liabilities 15,956 12,880 11,599
Vehicle insurance reserves 3,308 12,437 31,882
Other (342) 1,422 1,041
Net cash provided by operating activities 461,891 441,020 432,084
CASH FLOWS FROM INVESTING ACTIVITIES:
Revenue-earning vehicles:
Purchases (4,182,123) (3,919,650) (3,527,250)
Proceeds from sales 3,387,672 3,687,368 3,095,907
Net change in restricted cash and investments 412,392 (319,030)
85,665
Property, equipment and software:
Purchases (35,814) (31,766) (31,079)
Proceeds from sales 32 3,282 34
Acquisition of businesses, net of cash acquired (34,475) (5,224) (77,789)
Net cash used in investing activities (452,316) (585,020) (454,512)
(Continued)
45