Tesco 2015 Annual Report Download - page 99
Download and view the complete annual report
Please find page 99 of the 2015 Tesco annual report below. You can navigate through the pages in the report by either clicking on the pages listed below, or by using the keyword search tool below to find specific information within the annual report.-
 1
1 -
2
-
3
-
4
-
5
-
6
-
7
-
8
-
9
-
10
-
11
-
12
-
13
-
14
-
15
-
16
-
17
-
18
-
19
-
20
-
21
-
22
-
23
-
24
-
25
-
26
-
27
-
28
-
29
-
30
-
31
-
32
-
33
-
34
-
35
-
36
-
37
-
38
-
39
-
40
-
41
-
42
-
43
-
44
-
45
-
46
-
47
-
48
-
49
-
50
-
51
-
52
-
53
-
54
-
55
-
56
-
57
-
58
-
59
-
60
-
61
-
62
-
63
-
64
-
65
-
66
-
67
-
68
-
69
-
70
-
71
-
72
-
73
-
74
-
75
-
76
-
77
-
78
-
79
-
80
-
81
-
82
-
83
-
84
-
85
-
86
-
87
-
88
-
 89
89 -
 90
90 -
 91
91 -
 92
92 -
 93
93 -
 94
94 -
 95
95 -
 96
96 -
 97
97 -
 98
98 -
 99
99 -
 100
100 -
 101
101 -
 102
102 -
 103
103 -
 104
104 -
 105
105 -
 106
106 -
 107
107 -
 108
108 -
 109
109 -
110
-
111
-
112
-
113
-
114
-
115
-
116
-
117
-
118
-
119
-
120
-
121
-
122
-
123
-
124
-
125
-
126
-
127
-
128
-
129
-
130
-
131
-
132
-
133
-
134
-
135
-
136
-
137
-
138
-
139
-
140
-
141
-
142
-
143
-
144
-
145
-
146
-
147
-
148
-
149
-
150
-
151
-
152
-
153
-
154
-
155
-
156
-
157
-
158
-
159
-
160
 |
 |

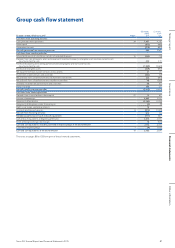
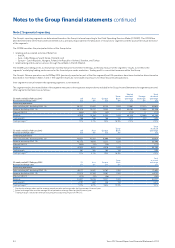
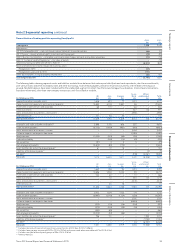
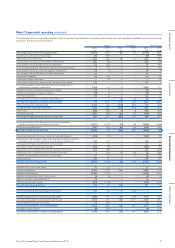
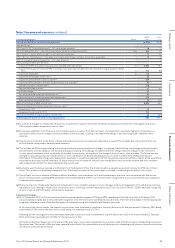
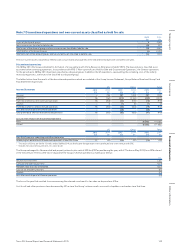
The following tables provide further analysis of the Group Cash Flow Statement, including a split of cash flows between Retail and Bank as well as continuing
operations and discontinued operations.
Retail Tesco Bank Tesco Group
2015
£m
2014
£m
2015
£m
2014
£m
2015
£m
2014
£m
Operating (loss)/profit of continuing operations (5,973) 2,489 181 142 (5,792) 2,631
Operating loss of discontinued operations (10) (925) ––(10) (925)
Depreciation and amortisation 1,466 1,483 86 84 1,552 1,567
Losses/(profits) arising on one-off property-related items 805 (98) ––805 (98)
Losses/(profits) arising on other property-related items 44 (134) ––44 (134)
Losses arising on property-related items from discontinued operations 5162 ––5162
Losses/(profits) arising on sale of non property-related items 39 (1) 7–46 (1)
Loss arising on sale of subsidiaries and other investments 41 1––41 1
Impairment of goodwill 116 540 ––116 540
Impairment of other investments –42 –––42
Impairment of investments in/loans to joint ventures and associates 712 –––712 –
Net charge of property, plant and equipment and intangible assets
not included in property-related items 3,316 715 4–3,320 715
Adjustment for non-cash element of pensions charges 68 11 ––68 11
Additional contribution into pension scheme (13) (4) ––(13) (4)
Share-based payments 99 46 61105 47
Tesco Bank non-cash items included in profit before tax ––58 76 58 76
Cash flow from operations excluding working capital 715 4,327 342 303 1,057 4,630
Decrease/(increase) in working capital 1,145 280 (735) (594) 410 (314)
Cash generated from/(used in) operations 1,860 4,607 (393) (291) 1,467 4, 316
Interest paid (609) (490) (4) (6) (613) (496)
Corporation tax paid (347) (612) (23) (23) (370) (635)
Net cash generated from/(used in) operating activities 904 3,505 (420) (320) 484 3,185
Purchase of property, plant and equipment, investment property
and non-current assets classified as held for sale (1,977) (2,473) (12) (16) (1,989) (2,489)
Purchase of intangible assets (267) (301) (62) (91) (329) (392)
Non-GAAP measure: Free cash flow (1,340) 731 (494) (427) (1,834) 304
Acquisition/disposal of subsidiaries, net of cash acquired/disposed (243) (13) ––(243) (13)
Proceeds from sale of property, plant and equipment, investment property,
intangible assets and non-current assets classified as held for sale 244 570 ––244 570
Net repayment of loans by joint ventures and associates 21 54 –721 61
Investments in joint ventures and associates (382) (12) ––(382) (12)
Net proceeds from sale of/(investments in) short-term investments 423 (494) ––423 (494)
Net proceeds from sale of/(investments in) other investments 5(207) 43 (61) 48 (268)
Dividends received from joint ventures and associates 81 47 715 88 62
Interest received 104 121 ––104 121
Net cash used in investing activities (1,991) (2,708) (24) (146) (2,015) (2,854)
Proceeds from issue of share capital 15 62 ––15 62
Increase in borrowings 4,385 3,104 498 –4,883 3,104
Repayment of borrowings (3,185) (1,912) ––(3,185) (1,912)
Repayment of obligations under finance leases (3) (9) ––(3) (9)
Rights issue to non-controlling interests 18 –––18 –
Dividends paid to equity owners (914) (1,189) ––(914) (1,189)
Net cash from financing activities 316 56 498 –814 56
Intra-Group funding and intercompany transactions (77) 104 77 (104) ––
Net (decrease)/increase in cash and cash equivalents (848) 957 131 (570) (717) 387
Cash and cash equivalents at the beginning of the year 2,328 1,476 485 1,055 2,813 2,531
Effect of foreign exchange rate changes 78 (105) ––78 (105)
Cash and cash equivalents at the end of the year 1,558 2,328 616 485 2,174 2,813
Cash held in disposal groups (9) (307) ––(9) (307)
Cash and cash equivalents not held in disposal groups 1,549 2,021 616 485 2,165 2,506
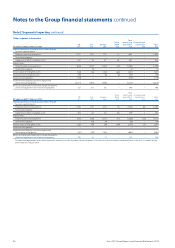
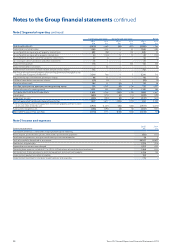
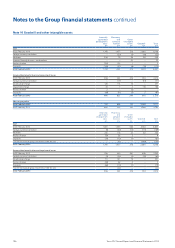
Note 2 Segmental reporting continued
97Tesco PLC Annual Report and Financial Statements 2015
Other informationGovernance Financial statementsStrategic report