Tesco 2015 Annual Report Download - page 126
Download and view the complete annual report
Please find page 126 of the 2015 Tesco annual report below. You can navigate through the pages in the report by either clicking on the pages listed below, or by using the keyword search tool below to find specific information within the annual report.-
 1
1 -
2
-
3
-
4
-
5
-
6
-
7
-
8
-
9
-
10
-
11
-
12
-
13
-
14
-
15
-
16
-
17
-
18
-
19
-
20
-
21
-
22
-
23
-
24
-
25
-
26
-
27
-
28
-
29
-
30
-
31
-
32
-
33
-
34
-
35
-
36
-
37
-
38
-
39
-
40
-
41
-
42
-
43
-
44
-
45
-
46
-
47
-
48
-
49
-
50
-
51
-
52
-
53
-
54
-
55
-
56
-
57
-
58
-
59
-
60
-
61
-
62
-
63
-
64
-
65
-
66
-
67
-
68
-
69
-
70
-
71
-
72
-
73
-
74
-
75
-
76
-
77
-
78
-
79
-
80
-
81
-
82
-
83
-
84
-
85
-
86
-
87
-
88
-
89
-
90
-
91
-
92
-
93
-
94
-
95
-
96
-
97
-
98
-
99
-
100
-
101
-
102
-
103
-
104
-
105
-
106
-
107
-
108
-
109
-
110
-
111
-
112
-
113
-
114
-
115
-
 116
116 -
 117
117 -
 118
118 -
 119
119 -
 120
120 -
 121
121 -
 122
122 -
 123
123 -
 124
124 -
 125
125 -
 126
126 -
 127
127 -
 128
128 -
 129
129 -
 130
130 -
 131
131 -
 132
132 -
 133
133 -
 134
134 -
 135
135 -
 136
136 -
137
-
138
-
139
-
140
-
141
-
142
-
143
-
144
-
145
-
146
-
147
-
148
-
149
-
150
-
151
-
152
-
153
-
154
-
155
-
156
-
157
-
158
-
159
-
160
 |
 |

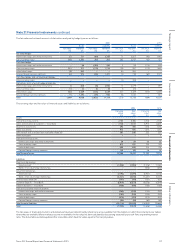
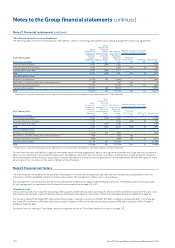
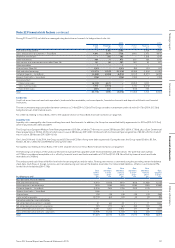
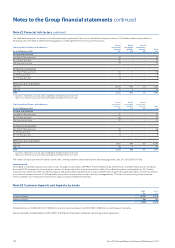
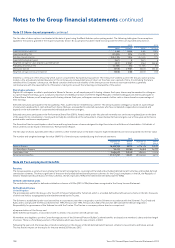
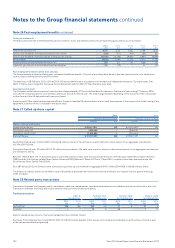
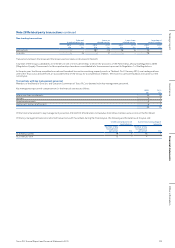
Note 22 Financial risk factors continued
The table below presents an analysis of credit exposure by impairment status across the different exposure classes. The table predominantly relates to
banking assets; the retail instalment lending applies to credit agreements in the insurance business.
Credit quality of loans and advances
As at 28 February 2015
Retail
unsecured
lending
£m
Retail
mortgage
lending
£m
Retail
instalment
lending
£m
Total
£m
Past due and defaulted
Less than 90 days past due 39 – – 39
90–179 days past due 35 – – 35
180 days plus past due 70 – – 70
Past due but not defaulted
Less than 29 days past due 34 2 – 36
30–59 days past due 9 – – 9
60–119 days past due 6 – – 6
Neither past due nor defaulted
Low risk* 6,234 1,195 154 7, 583
High risk** 76 6 – 82
Total 6,503 1,203 154 7,860
* Low risk is defined as an asset with a probability of default of less than 10%.
** High risk is defined as an asset with a probability of default of 10% or more.
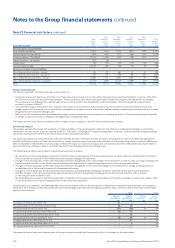
Credit quality of loans and advances
As at 22 February 2014
Retail
unsecured
lending
£m
Retail
mortgage
lending
£m
Retail
instalment
lending
£m
Total
£m
Past due and defaulted
Less than 90 days past due 45 – – 45
90–179 days past due 40 – – 40
180 days plus past due 50 – – 50
Past due but not defaulted
Less than 29 days past due 38 – – 38
30–59 days past due 9 – – 9
60–119 days past due 6 – – 6
Neither past due nor defaulted
Low risk* 5,923 692 167 6,782
High risk** 98 4 – 102
Total 6,209 696 167 7,072
* Low risk is defined as an asset with a probability of default of less than 10%.
** High risk is defined as an asset with a probability of default of 10% or more.
The credit risk exposure from off balance sheet items, mainly undrawn credit card facilities and mortgage offers, was £11.5bn (2014: £9.7bn).
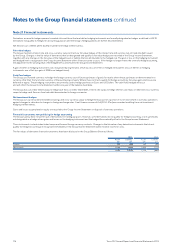
Insurance risk
Tesco Bank is indirectly exposed to insurance risks through its ownership of 49.9% of Tesco Underwriting Limited (‘TU’), an authorised insurance company.
Since late 2010 the majority of new business policies for home and motor insurance products sold by Tesco Bank have been underwritten by TU. The key
insurance risks within TU relate to underwriting risk and specifically the potential fora major weather event to generate significant claims on home insurance,
or on motor insurance the cost of settling bodily injury claims. Exposure tothis risk is actively managed within TU with close monitoring of performance
metrics and the use of reinsurance to limit TU’s exposure above predetermined limits.
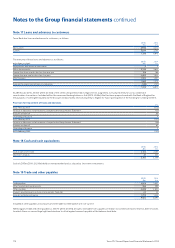
Note 23 Customer deposits and deposits by banks
2015
£m
2014
£m
Customer deposits 6,914 6,078
Deposits by banks 106 780
7,020 6,858
Included above is £1,000m (2014: £1,366m) non-current customer deposits and £nil (2014: £8m) non-current deposits by banks.
Deposits by banks include liabilities of £97m (2014: £765m) which have been sold under sale and repurchase agreements.
124 Tesco PLC Annual Report and Financial Statements 2015
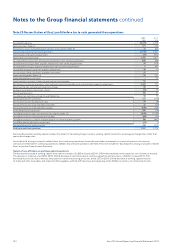
Notes to the Group financial statements continued