Tesco 2015 Annual Report Download - page 52
Download and view the complete annual report
Please find page 52 of the 2015 Tesco annual report below. You can navigate through the pages in the report by either clicking on the pages listed below, or by using the keyword search tool below to find specific information within the annual report.-
 1
1 -
2
-
3
-
4
-
5
-
6
-
7
-
8
-
9
-
10
-
11
-
12
-
13
-
14
-
15
-
16
-
17
-
18
-
19
-
20
-
21
-
22
-
23
-
24
-
25
-
26
-
27
-
28
-
29
-
30
-
31
-
32
-
33
-
34
-
35
-
36
-
37
-
38
-
39
-
40
-
41
-
 42
42 -
 43
43 -
 44
44 -
 45
45 -
 46
46 -
 47
47 -
 48
48 -
 49
49 -
 50
50 -
 51
51 -
 52
52 -
 53
53 -
 54
54 -
 55
55 -
 56
56 -
 57
57 -
 58
58 -
 59
59 -
 60
60 -
 61
61 -
 62
62 -
63
-
64
-
65
-
66
-
67
-
68
-
69
-
70
-
71
-
72
-
73
-
74
-
75
-
76
-
77
-
78
-
79
-
80
-
81
-
82
-
83
-
84
-
85
-
86
-
87
-
88
-
89
-
90
-
91
-
92
-
93
-
94
-
95
-
96
-
97
-
98
-
99
-
100
-
101
-
102
-
103
-
104
-
105
-
106
-
107
-
108
-
109
-
110
-
111
-
112
-
113
-
114
-
115
-
116
-
117
-
118
-
119
-
120
-
121
-
122
-
123
-
124
-
125
-
126
-
127
-
128
-
129
-
130
-
131
-
132
-
133
-
134
-
135
-
136
-
137
-
138
-
139
-
140
-
141
-
142
-
143
-
144
-
145
-
146
-
147
-
148
-
149
-
150
-
151
-
152
-
153
-
154
-
155
-
156
-
157
-
158
-
159
-
160
 |
 |

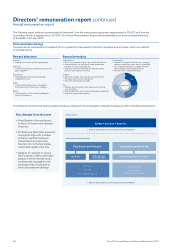
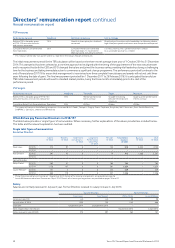
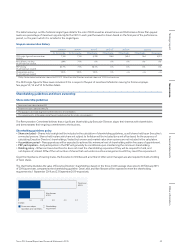
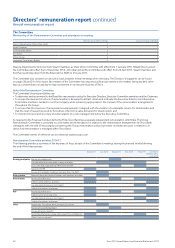
PSP measures
Performance measure Weighting Definition of measure Link to strategy
Relative TSR vs bespoke group
of FTSE 100 consumer business
and services companies
70% Growth in share price plus dividends
reinvested
Directly aligns Executives with shareholders in delivering relative
high share price growth and returns over the performance period
Cumulative Retail Cash Generated
from Operations
30% Cumulative Retail Cash Generated
from Operations +/- movement in
Working Capital, excluding Tesco Bank*
Is a measure of business performance that is critical
to a sustainable position as a retailer
* This measure will be fully transparent and be as reported in the Group’s Report and Accounts.
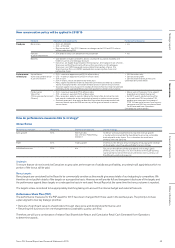
The initial measurement period for the TSR calculation will be based on the three-month average share price of 1 October 2014 to 31 December
2014. This start period has been selected as a one-time approach to be aligned with the timing of the appointment of the new executive team
and to recognise that both the CEO and CFO changed their plans and joined the business earlier, providing vital leadership during a challenging
time for the business and taking immediate action to commence a significant change programme. The performance period will continue to the
end of financial year 2017/18 to ensure that management is incentivised over three complete financial years and awards will not vest until three
years following the date of grant. The final measurement period will be 1 December 2017 to 28 February 2018. It is anticipated that any future
TSR initial measurement periods will revert to standard market practice, being the three months immediately prior to the start of the
performance period.
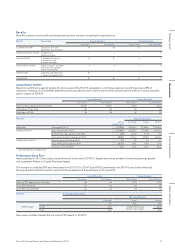
PSP targets
Performance measure Weighting Threshold Target Maximum
Relative TSR vs bespoke group of FTSE 100
consumer business and services companies*
70% Median performance
(25% vesting)
Straight line vesting
between threshold and
maximum
Upper quartile performance
(100% vesting)
Cumulative Retail Cash Generated from Operations 30% £8.2bn £8.6bn £9.0bn
* This group will comprise the following companies: Associated British Foods, Compass, Diageo, Dixons Carphone, Kingfisher, M&S, Morrisons, Next, Reckitt Benckiser,
SABMiller, J Sainsbury, Unilever and Whitbread.
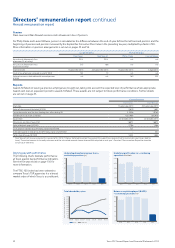
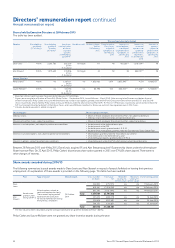
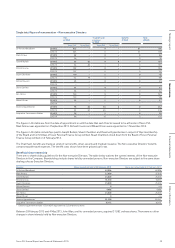
What did we pay Executive Directors in 2014/15?
The table below provides a ‘single figure’ of remuneration. Where necessary, further explanations of the values provided are included below.
This table and the relevant explanation has been audited.
Single total figure of remuneration
Executive Directors
Salary
(£’000)
Benefits
(£’000)
Short-term
annual bonus
(£’000)
Long-term
Performance
Share Plan
(£’000)
Pension
(£’000)
Total before
buyouts
(£’000)
Buyouts
(£’000)
Total
(£’000)
Dave Lewis 2014/15 570 97 0 – 143 810 3,323 4,133
2013/14 – – – – – – – –
Alan Stewart 2014/15 297 42 0 – 74 413 1,888 2,301
2013/14 – – – – – – – –
Former Directors
Philip Clarke*2014/15 563 41 0 0 160 764 –764
2013/14 1,136 107 0 0 391 1,634 –1,634
Laurie McIlwee** 2014/15 101 5 0 0 223 329 –329
2013/14 880 119 0 0 537 1,536 –1,536
* Philip Clarke ceased to be a Director on 1 September 2014. Details of his leaving arrangements are provided on page 56.
** Laurie Mcllwee ceased to be a Director on 4 April 2014. Details of his leaving arrangements are provided on pages 56 and 57.
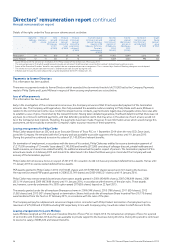
Salary
Salaries are normally reviewed in July each year. Former Directors received no salary increase in July 2014.
Current Directors Former Directors
Dave Lewis Alan Stewart Philip Clarke Laurie McIlwee
Increase in year (%) n/a n/a Nil Nil
Annual salary (£’000) 1,250 750 1,145 886
Start date 1 September 2014 23 September 2014 – –
Date stepped down from Board – – 1 September 2014 4 April 2014
Salary received in year (£’000) 570 297 563 101
50 Tesco PLC Annual Report and Financial Statements 2015
Directors’ remuneration report continued
Annual remuneration report