Tesco 2015 Annual Report Download - page 15
Download and view the complete annual report
Please find page 15 of the 2015 Tesco annual report below. You can navigate through the pages in the report by either clicking on the pages listed below, or by using the keyword search tool below to find specific information within the annual report.-
 1
1 -
2
-
3
-
4
-
 5
5 -
 6
6 -
 7
7 -
 8
8 -
 9
9 -
 10
10 -
 11
11 -
 12
12 -
 13
13 -
 14
14 -
 15
15 -
 16
16 -
 17
17 -
 18
18 -
 19
19 -
 20
20 -
 21
21 -
 22
22 -
 23
23 -
 24
24 -
 25
25 -
26
-
27
-
28
-
29
-
30
-
31
-
32
-
33
-
34
-
35
-
36
-
37
-
38
-
39
-
40
-
41
-
42
-
43
-
44
-
45
-
46
-
47
-
48
-
49
-
50
-
51
-
52
-
53
-
54
-
55
-
56
-
57
-
58
-
59
-
60
-
61
-
62
-
63
-
64
-
65
-
66
-
67
-
68
-
69
-
70
-
71
-
72
-
73
-
74
-
75
-
76
-
77
-
78
-
79
-
80
-
81
-
82
-
83
-
84
-
85
-
86
-
87
-
88
-
89
-
90
-
91
-
92
-
93
-
94
-
95
-
96
-
97
-
98
-
99
-
100
-
101
-
102
-
103
-
104
-
105
-
106
-
107
-
108
-
109
-
110
-
111
-
112
-
113
-
114
-
115
-
116
-
117
-
118
-
119
-
120
-
121
-
122
-
123
-
124
-
125
-
126
-
127
-
128
-
129
-
130
-
131
-
132
-
133
-
134
-
135
-
136
-
137
-
138
-
139
-
140
-
141
-
142
-
143
-
144
-
145
-
146
-
147
-
148
-
149
-
150
-
151
-
152
-
153
-
154
-
155
-
156
-
157
-
158
-
159
-
160
 |
 |

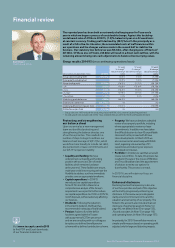
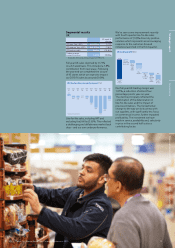
Segmental results
UK
52 week %
change
UK sales* (inc. VAT) £48,231m (1.7)%
UK revenue* (exc. VAT) £43,573m (1.8)%
UK trading profit £467m (78.8)%
Trading margin
(trading profit/revenue) 1.07% (394)bp
* Excludes the accounting impact of IFRIC 13.
Full year UK sales declined by (1.7)%
on a 52 week basis. This included a 1.8%
contribution from new space. Following
the year end we completed the closure
of 43 stores which we expect to impact
our 2015/16 sales by around (0.4)%.
UK like-for-like sales performance* (%)
11/12
1H
11/12
2H
12/13
1H
12/13
2H
13/14
1H
13/14
2H
14/15
1Q
14/15
2Q
14/15
3Q
14/15
4Q
0.5
(0.5)(0.6)
(0.1)
(0.5)
(2.2)
(3.7)
(5.4)
(4.2)
(1.0)
* Including VAT, excluding fuel.
Like-for-like sales, including VAT and
excluding fuel, fell by (3.6)%. This reflected
a challenging and deflationary market back
drop – and our own underperformance.
We’ve seen some improvement recently
with fourth quarter like-for-like sales
performance of (1.0)% driven by positive
volumes which represents an encouraging
response to the customer-focused
initiatives launched in the third quarter.
UK trading profit (£m)
UK trading
profit
FY 13/14
2,191
Prior year
commercial
income adj. Direct
impact
of LFL
sales
decline
Prior
initiatives3Q and
4Q
investment
in offer
Other
including
net cost
base
inflation
UK trading
profit
FY 14/15
467
Our full year UK trading margin was
1.07%, a reduction of almost four
percentage points year-on-year.
The decline principally reflected the
combination of the deterioration in
like-for-like sales and the impact of
previous initiatives. The fundamental
change to the way we do business with
our suppliers, with significantly less focus
on commercial income, further impacted
profitability. The investment we have
made in service, availability and, selectively
in price in the second half is also a
contributing factor.
Other informationGovernance Financial statementsStrategic report
13Tesco PLC Annual Report and Financial Statements 2015