Tesco 2015 Annual Report Download - page 16
Download and view the complete annual report
Please find page 16 of the 2015 Tesco annual report below. You can navigate through the pages in the report by either clicking on the pages listed below, or by using the keyword search tool below to find specific information within the annual report.-
 1
1 -
2
-
3
-
4
-
5
-
 6
6 -
 7
7 -
 8
8 -
 9
9 -
 10
10 -
 11
11 -
 12
12 -
 13
13 -
 14
14 -
 15
15 -
 16
16 -
 17
17 -
 18
18 -
 19
19 -
 20
20 -
 21
21 -
 22
22 -
 23
23 -
 24
24 -
 25
25 -
 26
26 -
27
-
28
-
29
-
30
-
31
-
32
-
33
-
34
-
35
-
36
-
37
-
38
-
39
-
40
-
41
-
42
-
43
-
44
-
45
-
46
-
47
-
48
-
49
-
50
-
51
-
52
-
53
-
54
-
55
-
56
-
57
-
58
-
59
-
60
-
61
-
62
-
63
-
64
-
65
-
66
-
67
-
68
-
69
-
70
-
71
-
72
-
73
-
74
-
75
-
76
-
77
-
78
-
79
-
80
-
81
-
82
-
83
-
84
-
85
-
86
-
87
-
88
-
89
-
90
-
91
-
92
-
93
-
94
-
95
-
96
-
97
-
98
-
99
-
100
-
101
-
102
-
103
-
104
-
105
-
106
-
107
-
108
-
109
-
110
-
111
-
112
-
113
-
114
-
115
-
116
-
117
-
118
-
119
-
120
-
121
-
122
-
123
-
124
-
125
-
126
-
127
-
128
-
129
-
130
-
131
-
132
-
133
-
134
-
135
-
136
-
137
-
138
-
139
-
140
-
141
-
142
-
143
-
144
-
145
-
146
-
147
-
148
-
149
-
150
-
151
-
152
-
153
-
154
-
155
-
156
-
157
-
158
-
159
-
160
 |
 |

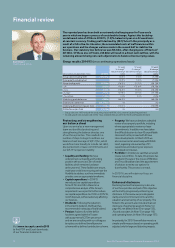
Financial review continued
Visit www.tescoplc.com/ar2015
to find PDF and Excel downloads
of our financial statements
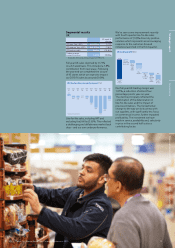
Asia
52 week %
change
at actual
rates
52 week %
change at
constant
rates
Asia sales*
(including VAT) £10,501m (4.1)% (0.9)%
Asia revenue*
(excluding VAT) £9,884m (4.1)% (0.9)%
Asia trading
profit £565m (18.4)% (15.3)%
Trading margin
(trading profit/revenue) 5.72% (100)bp (97)bp
* Excludes the accounting impact of IFRIC 13.
Sales in Asia declined by (4.1)% including
a (3.2)% impact from foreign exchange.
Like-for-like sales were (4.4)%. In South
Korea, the impact of the DIDA regulations
has remained significant whilst in Thailand
the recovery in consumer spending has
been slower to materialise than initially
anticipated. Our trading performance in
Malaysia has been impacted by protests
against some Western-owned businesses
and a challenging economic environment.
Our trading profit in Asia was (15.3)% lower
year-on-year at constant rates, primarily
due to the operational gearing effect from
the impact of negative like-for-like sales
performances in all three markets.
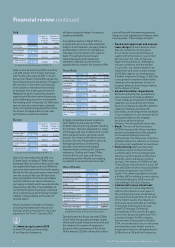
Europe
52 week %
change
at actual
rates
52 week %
change at
constant
rates
Europe sales*
(including VAT) £9,898m (8.5)% (0.6)%
Europe revenue*
(excluding VAT) £8,515m (8.5)% (0.7)%
Europe trading
profit £164m (31.9)% (31.1)%
Trading margin
(trading profit/revenue) 1.93% (66)bp (64)bp
* Excludes the accounting impact of IFRIC 13.
Sales in Europe reduced by (8.5)% on a
52 week basis including a (7.9)% foreign
exchange effect as the Euro fell to seven-year
lows against Sterling by year-end. Whilst we
saw some improvement in the fourth quarter,
the like-for-like sales performance was mixed
over the course of the year. We have seen
strong competition from discount retailers
and this held back our sales performance,
particularly in Ireland which saw a like-for-like
sales decline of (6.3)%. The profitability of
our Central European businesses continued
to be under pressure and in Turkey included
a £(30)m charge relating to the write-off
of a fuel debtor.
Recent legislative changes in Hungary,
including mandated store closures on
Sundays and the introduction of a ‘food
supervision fee’ from 1 January 2015,
will have a material impact to ongoing
market profitability.
Consultation started in March 2015 on
a significant restructure of the leadership
team for Czech Republic, Hungary, Poland
and Slovakia to move from operating as
individual country teams to one regional
team. This restructuring will create
substantial buying and operational
synergies, helping us to unlock more
opportunities to invest in the customer offer.
Tesco Bank
TY LY YOY Change
Revenue £1,024m £1,003m 2.1%
Trading Profit £194m £194m 0.0%
Lending to
customers £ 7,720m £6,915m 11.6%
Customer
deposits £6,913m £6,079m 13.7%
Net interest
margin 4.2% 4.4% (0.2)%
Underlying cost:
income ratio 65.0% 64.0% (1.0)%
Bad debt asset
ratio 0.7% 1.0% +0.3%
Risk asset ratio 18.8% 17.7% +1.1%
Loan to deposit
ratio 111.7% 113.8% +2.1%
In highly competitive market conditions,
Tesco Bank’s revenue was up 2.1% to
£1,024m driven by strong growth in lending
to customers. We have expanded our range
of mortgage and loan products and, in June
2014, we launched our personal current
account. Our motor and home insurance
business has seen 3% growth in accounts
having expanded our underwriting
providers and implemented digital
improvements to enhance the customer
experience. Trading profit was £194m,
in line with the prior year, with strong
underlying growth offset by our ongoing
investment in personal current accounts.
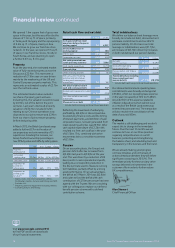
One-off items
TY LY*
PPE impairment and
onerous lease charges £(4,727)m £(636)m
Goodwill and other
impairments £(878)m –
Stock £(570)m –
Restructuring £(416)m –
Commercial income
adjustment
–Recognised in 13/14 £(53)m –
–Recognised in years
prior to 13/14 £(155)m –
Other £(223)m £(165)m
Total one-off items £(7,022)m £(801)m
* Last year’s number is before a £(540)m write-down
of goodwill relating to discontinued operations.
During the year the Group incurred £(7.0)bn
of one-off and restructuring charges, largely
reflecting the weak industry environment and
the initiation of a number of measures to
turnaround the performance of the Group.
Of this amount, £(0.6)bn will result in a direct
cash outflow, with the remaining amounts
being non-cash adjustments to balance sheet
carrying values. These charges included:
• Fixed asset impairment and onerous
lease charges: At each balance sheet
date we review the carrying value
of our stores to ensure that they are
supported by their value in use or their
fair value less the costs of disposal.
Against the backdrop of challenging
industry conditions and the decline
in our profit, our review resulted in an
impairment and onerous lease charge
of £(3.8)bn against our trading stores.
A further impairment charge of £(925)m
is recognised in property related items,
relating to the impairment of work-in-
progress balances and charges relating
to the closure of stores.
• Goodwill and other impairments:
We have booked further goodwill and
other impairments totalling £(878)m.
These include an impairment of £(630)m
relating to our investment with China
Resources Enterprise Ltd (CRE), £(116)m
relating to Dobbies and other UK
businesses, and an impairment of £(82)m
in our investment in joint ventures which
principally relates to the strategic
decision to slow the roll out
of Harris + Hoole and Euphorium sites.
• Stock: The one-off items include a
£(570)m charge to the Group inventory
position, principally due to the adoption
of a forward-looking provisioning
methodology. The charge also includes a
£(168)m impact of a reduction in the level
of in-store costs capitalised to inventories.
• Restructuring: We have described
a restructuring of central overheads,
a simplification of store management
structures and increased working-hour
flexibility, which will deliver ongoing
savings in the region of £400m per year.
These efficiencies will result in a one-off
cost of £(350)m of which around £(300)m
has been recognised in our 2014/15
results. The remaining balance includes
a further £(41)m relating to restructuring
in the first half and a £(20)m one-off
cost relating to UK store closures.
• Commercial income adjustment:
The commercial income adjustment
refers to the impact on prior years of
the commercial income issues that we
announced last September. At the time
of the interim results, the impacts on
prior years were estimated as resulting
in the profit before tax for the year
ended 22 February 2014 being
overstated by £70m, and for the years
prior to this being overstated by £75m –
a combined total of £145m relating
to prior years. Subsequent to October
2014, we continued to focus on this area
and identified some further amounts,
bringing the total one-off adjustment to
£208m for our UK and Irish businesses.
14 Tesco PLC Annual Report and Financial Statements 2015