Tesco 2015 Annual Report Download - page 88
Download and view the complete annual report
Please find page 88 of the 2015 Tesco annual report below. You can navigate through the pages in the report by either clicking on the pages listed below, or by using the keyword search tool below to find specific information within the annual report.-
 1
1 -
2
-
3
-
4
-
5
-
6
-
7
-
8
-
9
-
10
-
11
-
12
-
13
-
14
-
15
-
16
-
17
-
18
-
19
-
20
-
21
-
22
-
23
-
24
-
25
-
26
-
27
-
28
-
29
-
30
-
31
-
32
-
33
-
34
-
35
-
36
-
37
-
38
-
39
-
40
-
41
-
42
-
43
-
44
-
45
-
46
-
47
-
48
-
49
-
50
-
51
-
52
-
53
-
54
-
55
-
56
-
57
-
58
-
59
-
60
-
61
-
62
-
63
-
64
-
65
-
66
-
67
-
68
-
69
-
70
-
71
-
72
-
73
-
74
-
75
-
76
-
77
-
 78
78 -
 79
79 -
 80
80 -
 81
81 -
 82
82 -
 83
83 -
 84
84 -
 85
85 -
 86
86 -
 87
87 -
 88
88 -
 89
89 -
 90
90 -
 91
91 -
 92
92 -
 93
93 -
 94
94 -
 95
95 -
 96
96 -
 97
97 -
 98
98 -
99
-
100
-
101
-
102
-
103
-
104
-
105
-
106
-
107
-
108
-
109
-
110
-
111
-
112
-
113
-
114
-
115
-
116
-
117
-
118
-
119
-
120
-
121
-
122
-
123
-
124
-
125
-
126
-
127
-
128
-
129
-
130
-
131
-
132
-
133
-
134
-
135
-
136
-
137
-
138
-
139
-
140
-
141
-
142
-
143
-
144
-
145
-
146
-
147
-
148
-
149
-
150
-
151
-
152
-
153
-
154
-
155
-
156
-
157
-
158
-
159
-
160
 |
 |

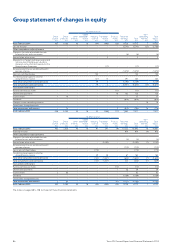
All other reserves
Share
capital
£m
Share
premium
£m
Other
reserves
£m
Capital
redemption
reserve
£m
Hedging
reserve
£m
Translation
reserve
£m
Treasur y
shares
£m
Retained
earnings
£m
Total
£m
Non-
controlling
interests
£m
Total
equity
£m
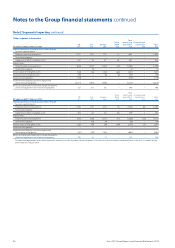
At 22 February 2014 405 5,080 40 16 (44) (490) (20) 9,728 14,715 714,722
Loss for the year –––––––(5,741) (5,741) (25) (5,766)
Other comprehensive (loss)/income
Change in fair value of available-for-sale
financial assets and investments –––––––(8) (8) –(8)
Retranslation of net assets – – – – – 5 – – 5 – 5
Movements in foreign exchange reserve and
net investment hedging on subsidiary
disposed, reclassified and reported in the
Group Income Statement – – – – – (17) – – (17) –(17)
Remeasurement losses on defined benefit
pension schemes –––––––(1,473) (1,473) –(1,473)
Gains on cash flow hedges – – – – 100 – – – 100 –100
Tax relating to components of other
comprehensive income – – – – (21) 14 –291 284 –284
Total other comprehensive (loss)/income – – – – 79 2 – (1,190) (1,109) –(1,109)
Total comprehensive (loss)/income – – – – 79 2 – (6 ,931) (6,850) (25) (6,875)
Transactions with owners
Purchase of treasury shares – – – – – – (15) –(15) –(15)
Share-based payments – – – – – – 18 102 120 –120
Issue of shares 114 – – – – – – 15 –15
Dividends –––––––(914) (914) –(914)
Changes in non-controlling interests –––––––––18 18
Tax on items charged to equity –––––––––––
Total transactions with owners 114 – – – – 3 (812) (794) 18 (776)
At 28 February 2015 406 5,094 40 16 35 (488) (17) 1,985 7,071 –7,071
All other reserves
Share
capital
£m
Share
premium
£m
Other
reserves
£m
Capital
redemption
reserve
£m
Hedging
reserve
£m
Translation
reserve
£m
Treasur y
shares
£m
Retained
earnings
£m
Total
£m
Non-
controlling
interests
£m
Total
equity
£m
At 23 February 2013 403 5,020 40 16 91 547 (9) 10,535 16,643 18 16,661
Profit for the year –––––––974 974 (4) 970
Other comprehensive (loss)/income
Change in fair value of available-for-sale
financial assets and investments –––––––(4) (4) –(4)
Retranslation of net assets –––––(1,095) – – (1,095) (7) (1,102)
Remeasurement losses on defined benefit
pension schemes –––––––(713) (713) –(713)
Losses on cash flow hedges – – – – (174) –––(174) –(174)
Tax relating to components of other
comprehensive income – – – – 39 58 –67 164 –164
Total other comprehensive (loss)/income – – – – (135) (1,037) –(650) (1,822) (7) (1,829)
Total comprehensive (loss)/income – – – – (135) (1,037) –324 (848) (11) (859)
Transactions with owners
Purchase of treasury shares – – – – – – (12) –(12) –(12)
Share-based payments – – – – – – 1 58 59 – 59
Issue of shares 260 ––––––62 –62
Dividends –––––––(1,189) (1,189) –(1,189)
Tax on items charged to equity –––––––––––
Total transactions with owners 260 – – – – (11) (1,131) (1,080) –(1,080)
At 22 February 2014 405 5,080 40 16 (44) (490) (20) 9,728 14,715 714,722
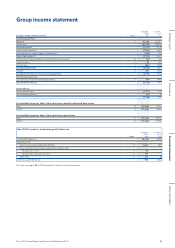
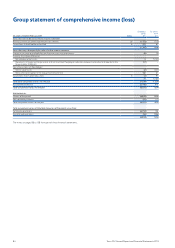
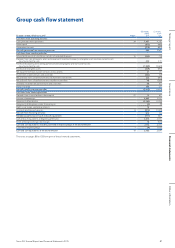
The notes on pages 88 to 138 form part of these financial statements.
86 Tesco PLC Annual Report and Financial Statements 2015
Group statement of changes in equity