Tesco 2015 Annual Report Download - page 119
Download and view the complete annual report
Please find page 119 of the 2015 Tesco annual report below. You can navigate through the pages in the report by either clicking on the pages listed below, or by using the keyword search tool below to find specific information within the annual report.-
 1
1 -
2
-
3
-
4
-
5
-
6
-
7
-
8
-
9
-
10
-
11
-
12
-
13
-
14
-
15
-
16
-
17
-
18
-
19
-
20
-
21
-
22
-
23
-
24
-
25
-
26
-
27
-
28
-
29
-
30
-
31
-
32
-
33
-
34
-
35
-
36
-
37
-
38
-
39
-
40
-
41
-
42
-
43
-
44
-
45
-
46
-
47
-
48
-
49
-
50
-
51
-
52
-
53
-
54
-
55
-
56
-
57
-
58
-
59
-
60
-
61
-
62
-
63
-
64
-
65
-
66
-
67
-
68
-
69
-
70
-
71
-
72
-
73
-
74
-
75
-
76
-
77
-
78
-
79
-
80
-
81
-
82
-
83
-
84
-
85
-
86
-
87
-
88
-
89
-
90
-
91
-
92
-
93
-
94
-
95
-
96
-
97
-
98
-
99
-
100
-
101
-
102
-
103
-
104
-
105
-
106
-
107
-
108
-
 109
109 -
 110
110 -
 111
111 -
 112
112 -
 113
113 -
 114
114 -
 115
115 -
 116
116 -
 117
117 -
 118
118 -
 119
119 -
 120
120 -
 121
121 -
 122
122 -
 123
123 -
 124
124 -
 125
125 -
 126
126 -
 127
127 -
 128
128 -
 129
129 -
130
-
131
-
132
-
133
-
134
-
135
-
136
-
137
-
138
-
139
-
140
-
141
-
142
-
143
-
144
-
145
-
146
-
147
-
148
-
149
-
150
-
151
-
152
-
153
-
154
-
155
-
156
-
157
-
158
-
159
-
160
 |
 |

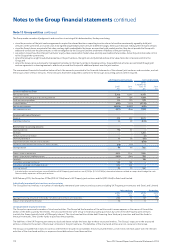
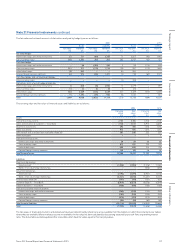
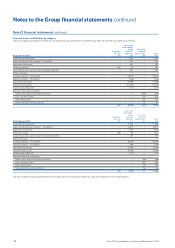
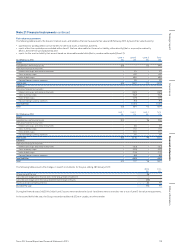
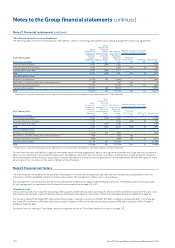
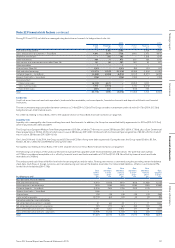
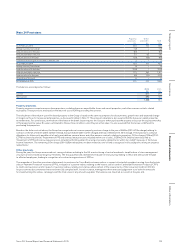
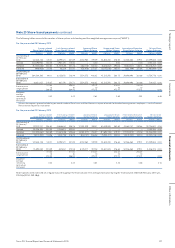
Note 21 Financial instruments continued
The fair value and notional amounts of derivatives analysed by hedge type are as follows:
2015 2014
Asset Liability Asset Liability
Fair value
£m
Notional
£m
Fair value
£m
Notional
£m
Fair value
£m
Notional
£m
Fair value
£m
Notional
£m
Fair value hedges
Interest rate swaps and similar instruments 23 721 (80) 2,303 71 2,057 (42) 1,492
Cross-currency swaps 561 1,201 (11) 817 583 2,055 (25) 551
Cash flow hedges
Interest rate swaps and similar instruments –86 (199) 462 299 (110) 400
Cross-currency swaps 241 311 (170) 1,754 139 287 (115) 1,605
Index-linked swaps 119 942 – – 90 920 – –
Forward foreign currency contracts 84 974 (35) 1,271 10 739 (62) 2,123
Cash flow hedges and net investment hedges
Cross-currency swaps – – – – 10 308 – –
Derivatives not in a formal hedge relationship
Interest rate swaps and similar instruments 6640 (6) 2,982 13 2,079 –595
Cross-currency swaps 10 44 (1) 36 8128 – –
Index-linked swaps 580 3,589 (474) 3,589 614 3,619 (515) 3,589
Forward foreign currency contracts 75 1,292 (59) 965 36 1,035 –181
Total 1,699 9,800 (1,035) 14,179 1,576 13,326 (869) 10,536
The carrying value and fair value of financial assets and liabilities are as follows:
2015 2014
Carrying
value
£m
Fair
value
£m
Carrying
value
£m
Fair
value
£m
Assets
Cash and cash equivalents 2,165 2,165 2,506 2,506
Loans and advances to customers – Tesco Bank 7,720 7,772 6,915 6,845
Short-term investments 593 593 1,016 1,016
Other investments 975 975 1,015 1,015
Joint venture and associates loan receivables (Note 28) 207 208 255 257
Other receivables 1 1 1 1
Derivative financial assets:
Interest rate swaps and similar instruments 29 29 86 86
Cross-currency swaps 812 812 740 740
Index-linked swaps 699 699 704 704
Forward foreign currency contracts 159 159 46 46
Total financial assets 13,360 13,413 13,284 13,216
Liabilities
Short-term borrowings:
Amortised cost (1,998) (1,998) (1,276) (1,281)
Bonds in fair value hedge relationships – – (628) (660)
Long-term borrowings:
Amortised cost (7,193) ( 7, 299) (4,901) (5,702)
Bonds in fair value hedge relationships (3,327) (3,033) (4,287) (4,227)
Finance leases (Note 34) (141) (141) (121) (121)
Customer deposits – Tesco Bank (6,914) (6,873) (6,078) (6,044)
Deposits by banks – Tesco Bank (106) (106) (780) (780)
Derivative and other financial liabilities:
Interest rate swaps and similar instruments (285) (285) (152) (152)
Cross-currency swaps (182) (182) (140) (140)
Index-linked swaps (474) (474) (515) (515)
Forward foreign currency contracts (94) (94) (62) (62)
Total financial liabilities (20,714) (20,485) (18,940) (19,684)
Total (7, 354) (7,072) (5,656) (6,468)
The fair values of financial instruments and derivatives have been determined by reference to prices available from the markets on which the instruments are traded,
where they are available. Where market prices are not available, the fair value has been calculated by discounting expected future cash flows at prevailing interest
rates. The above tables exclude payables/other receivables which have fair values equal to their carrying values.
117Tesco PLC Annual Report and Financial Statements 2015
Other informationGovernance Financial statementsStrategic report