Tesco 2015 Annual Report Download - page 152
Download and view the complete annual report
Please find page 152 of the 2015 Tesco annual report below. You can navigate through the pages in the report by either clicking on the pages listed below, or by using the keyword search tool below to find specific information within the annual report.-
 1
1 -
2
-
3
-
4
-
5
-
6
-
7
-
8
-
9
-
10
-
11
-
12
-
13
-
14
-
15
-
16
-
17
-
18
-
19
-
20
-
21
-
22
-
23
-
24
-
25
-
26
-
27
-
28
-
29
-
30
-
31
-
32
-
33
-
34
-
35
-
36
-
37
-
38
-
39
-
40
-
41
-
42
-
43
-
44
-
45
-
46
-
47
-
48
-
49
-
50
-
51
-
52
-
53
-
54
-
55
-
56
-
57
-
58
-
59
-
60
-
61
-
62
-
63
-
64
-
65
-
66
-
67
-
68
-
69
-
70
-
71
-
72
-
73
-
74
-
75
-
76
-
77
-
78
-
79
-
80
-
81
-
82
-
83
-
84
-
85
-
86
-
87
-
88
-
89
-
90
-
91
-
92
-
93
-
94
-
95
-
96
-
97
-
98
-
99
-
100
-
101
-
102
-
103
-
104
-
105
-
106
-
107
-
108
-
109
-
110
-
111
-
112
-
113
-
114
-
115
-
116
-
117
-
118
-
119
-
120
-
121
-
122
-
123
-
124
-
125
-
126
-
127
-
128
-
129
-
130
-
131
-
132
-
133
-
134
-
135
-
136
-
137
-
138
-
139
-
140
-
141
-
 142
142 -
 143
143 -
 144
144 -
 145
145 -
 146
146 -
 147
147 -
 148
148 -
 149
149 -
 150
150 -
 151
151 -
 152
152 -
 153
153 -
 154
154 -
 155
155 -
 156
156 -
 157
157 -
 158
158 -
 159
159 -
 160
160
 |
 |

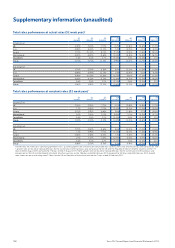
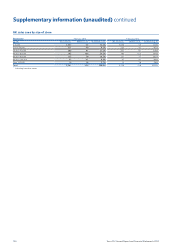
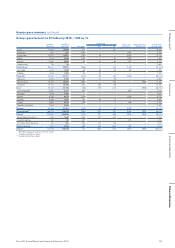
UK sales area by size of store
Store size February 2015 February 2014
sq. ft. No. of stores Million sq. ft. % of total sq. ft. No. of stores Million sq. ft. % of total sq. ft.
0–3,000 2,557 5.3 12.5% 2,378 5.0 12.0%
3,001–20,000 321 4.0 9.5% 322 4.1 9.7%
20,001–40,000 306 9.1 21.5% 305 9.1 21.8%
40,001–60,000 195 10.4 24.5% 193 10.2 24.4%
60,001–80,000 123 7.9 18.7% 121 7.7 18.5%
80,001–100,000 45 4.1 9.6% 45 4.1 9.8%
Over 100,000 14 1.6 3.7% 14 1.6 3.8%
Total*3,561 42.4 100.0% 3,378 41.8 100.0%
* Including franchise stores.
150 Tesco PLC Annual Report and Financial Statements 2015
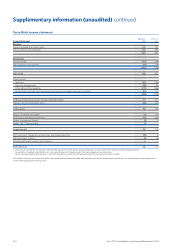
Supplementary information (unaudited) continued