Tesco 2015 Annual Report Download - page 132
Download and view the complete annual report
Please find page 132 of the 2015 Tesco annual report below. You can navigate through the pages in the report by either clicking on the pages listed below, or by using the keyword search tool below to find specific information within the annual report.-
 1
1 -
2
-
3
-
4
-
5
-
6
-
7
-
8
-
9
-
10
-
11
-
12
-
13
-
14
-
15
-
16
-
17
-
18
-
19
-
20
-
21
-
22
-
23
-
24
-
25
-
26
-
27
-
28
-
29
-
30
-
31
-
32
-
33
-
34
-
35
-
36
-
37
-
38
-
39
-
40
-
41
-
42
-
43
-
44
-
45
-
46
-
47
-
48
-
49
-
50
-
51
-
52
-
53
-
54
-
55
-
56
-
57
-
58
-
59
-
60
-
61
-
62
-
63
-
64
-
65
-
66
-
67
-
68
-
69
-
70
-
71
-
72
-
73
-
74
-
75
-
76
-
77
-
78
-
79
-
80
-
81
-
82
-
83
-
84
-
85
-
86
-
87
-
88
-
89
-
90
-
91
-
92
-
93
-
94
-
95
-
96
-
97
-
98
-
99
-
100
-
101
-
102
-
103
-
104
-
105
-
106
-
107
-
108
-
109
-
110
-
111
-
112
-
113
-
114
-
115
-
116
-
117
-
118
-
119
-
120
-
121
-
 122
122 -
 123
123 -
 124
124 -
 125
125 -
 126
126 -
 127
127 -
 128
128 -
 129
129 -
 130
130 -
 131
131 -
 132
132 -
 133
133 -
 134
134 -
 135
135 -
 136
136 -
 137
137 -
 138
138 -
 139
139 -
 140
140 -
 141
141 -
 142
142 -
143
-
144
-
145
-
146
-
147
-
148
-
149
-
150
-
151
-
152
-
153
-
154
-
155
-
156
-
157
-
158
-
159
-
160
 |
 |

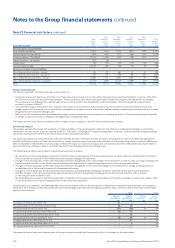
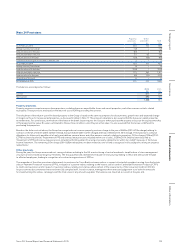
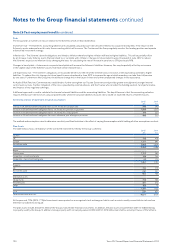
Risks
The Group bears a numbers of risks in relation to the Scheme, which are described below:
Investment risk – The Scheme’s accounting liabilities are calculated using a discount rate set with reference to corporate bond yields. If the return on the
Scheme’s assets underperform this rate, the accounting deficit will increase. The Trustee and the Group regularly monitor the funding position and operate
a diversified investment strategy.
Inflation risk – The Scheme’s benefit obligations are linked to inflation therefore higher inflation will lead to higher liabilities. This will be partially offset
by an increase in any Scheme assets that are linked to, or correlate with, inflation. Changes to future benefits were introduced in June 2012 to reduce
the Scheme’s exposure to inflation risk by changing the basis for calculating the rate of increase in pensions to CPI (previously RPI).
Changes in bond yields – A decrease in corporate bond yields will increase the Scheme’s liabilities. However, this may be partially offset by an increase
in the capital value of the Scheme’s assets that have similar characteristics.
Life expectancy risk – The Scheme’s obligations are to provide benefits for the life of the member and so increases in life expectancy will lead to higher
liabilities. To reduce this risk, changes to future benefits were introduced in June 2012 to increase the age at which members can take their full pension
by two years. Furthermore the Group has the ability to change this in the future if there are further unexpected changes in life expectancy.
An Audit & Risk Pensions Committee was established to further strengthen our Trustee Governance and provide greater oversight and stronger internal
control over our risks. Further mitigation of the risks is provided by external advisors and the Trustee who consider the funding position, fund performance,
and impacts of any regulatory changes.
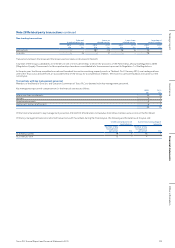
A different approach is used to calculate the triennial actuarial liabilities and the accounting liabilities. The key difference is that the accounting valuation
requires the discount rate to be set using corporate bonds whilst the actuarial liabilities discount rate is based on expected returns of Scheme assets.
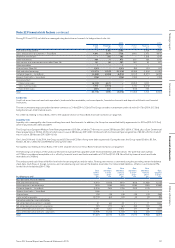
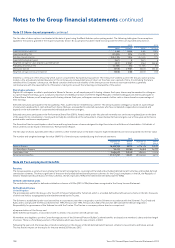
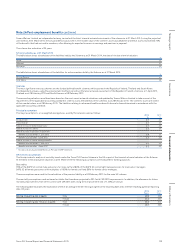
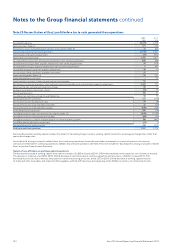
Sensitivity analysis of significant actuarial assumptions
2015
£m
2014
£m
Change in UK defined benefit obligation from a 0.1% increase in discount rate 340 240
Increase in UK defined benefit obligation from a 1% increase in pensions in payment 1,920 1,210
Increase in UK defined benefit obligation from a 1% increase in salary growth 310 320
Increase in UK defined benefit obligation from each additional year of longevity assumed 490 350
The method and assumptions used to determine sensitivity and their limitation is the effect of varying the assumption whilst holding all other assumptions constant.
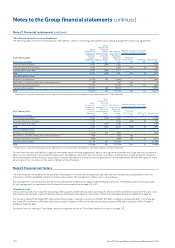
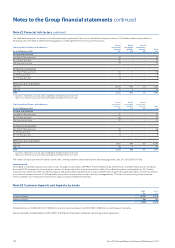
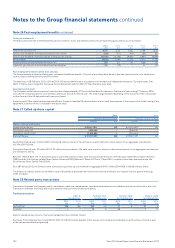
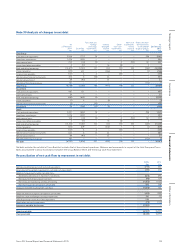
Plan Assets
The table below shows a breakdown of the combined investments held by the Group’s schemes:
2015
£m
2014
£m
Equities
UK 510 476
Europe 1,127 891
Rest of the world 3,866 3,029
5,503 4,396
Bonds
Government 1,122 280
Corporates – investment grade 316 744
Corporates – non-investment grade 43 170
1,481 1,194
Property
UK 704 519
Rest of the world 261 247
965 766
Alternative assets
Hedge funds 738 586
Private equity 491 472
Other 168 75
1,397 1,133
Cash 331 635
Total market value of assets 9,677 8,124
At the year end, 73% (2014: 77%) of investments were quoted on a recognised stock exchange or held in cash or assets readily convertible to cash and are
therefore considered to be liquid.
The plan assets include £nil (2014: £3m) of the Group’s transferable financial instruments. In addition, the plan assets include £166m (2014: £158m) relating
to property used by the Group. In addition, Group property with net carrying value of £434m (2014: £416m) has been held as security in favour of the Scheme.
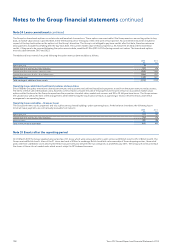
Note 26 Post-employment benefits continued
130 Tesco PLC Annual Report and Financial Statements 2015
Notes to the Group financial statements continued