Tesco 2015 Annual Report Download - page 131
Download and view the complete annual report
Please find page 131 of the 2015 Tesco annual report below. You can navigate through the pages in the report by either clicking on the pages listed below, or by using the keyword search tool below to find specific information within the annual report.-
 1
1 -
2
-
3
-
4
-
5
-
6
-
7
-
8
-
9
-
10
-
11
-
12
-
13
-
14
-
15
-
16
-
17
-
18
-
19
-
20
-
21
-
22
-
23
-
24
-
25
-
26
-
27
-
28
-
29
-
30
-
31
-
32
-
33
-
34
-
35
-
36
-
37
-
38
-
39
-
40
-
41
-
42
-
43
-
44
-
45
-
46
-
47
-
48
-
49
-
50
-
51
-
52
-
53
-
54
-
55
-
56
-
57
-
58
-
59
-
60
-
61
-
62
-
63
-
64
-
65
-
66
-
67
-
68
-
69
-
70
-
71
-
72
-
73
-
74
-
75
-
76
-
77
-
78
-
79
-
80
-
81
-
82
-
83
-
84
-
85
-
86
-
87
-
88
-
89
-
90
-
91
-
92
-
93
-
94
-
95
-
96
-
97
-
98
-
99
-
100
-
101
-
102
-
103
-
104
-
105
-
106
-
107
-
108
-
109
-
110
-
111
-
112
-
113
-
114
-
115
-
116
-
117
-
118
-
119
-
120
-
 121
121 -
 122
122 -
 123
123 -
 124
124 -
 125
125 -
 126
126 -
 127
127 -
 128
128 -
 129
129 -
 130
130 -
 131
131 -
 132
132 -
 133
133 -
 134
134 -
 135
135 -
 136
136 -
 137
137 -
 138
138 -
 139
139 -
 140
140 -
 141
141 -
142
-
143
-
144
-
145
-
146
-
147
-
148
-
149
-
150
-
151
-
152
-
153
-
154
-
155
-
156
-
157
-
158
-
159
-
160
 |
 |

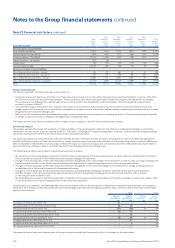
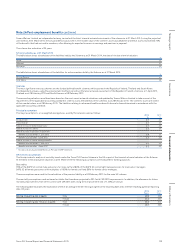
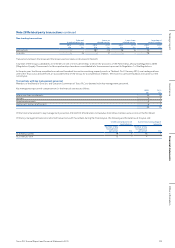
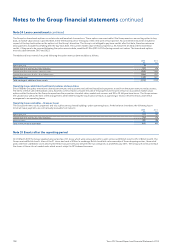
Towers Watson Limited, an independent actuary, carried out the latest triennial actuarial assessment of the scheme as at 31 March 2014, using the projected
unit method. At 31 March 2014, the actuarial deficit was £2,751m. The market value of the scheme’s assets was £8,020m and these assets represented 75%
of the benefits that had accrued to members, after allowing for expected increases in earnings and pensions in payment.
The scheme has a duration of 24 years.
Scheme Liabilities as at 31 March 2014
The table below shows a breakdown of the liabilities held by the Scheme as at 31 March 2014, the date of the last triennial valuation:
%
Active 55
Deferred 21
Pensioner 24
The table below shows a breakdown of the liabilities for active members held by the Scheme as at 31 March 2014:
%
Pension Builder 57
Final Salary 43
Overseas
The most significant overseas schemes are the funded defined benefit schemes which operate in the Republic of Ireland, Thailand and South Korea.
An independent actuary, using the projected unit method, carried out the latest actuarial assessment of the Republic of Ireland scheme as at 1 April 2013,
Thailand as at 28 February 2013 and South Korea as at 28 February 2015.
The accounting valuations used have been based on the most recent actuarial valuations and updated by Towers Watson Limited to take account of the
requirements of the applicable accounting standard in order to assess the liabilities of the schemes as at 28 February 2015. The schemes’ assets are stated
at their market values as at 28 February 2015. The liabilities relating to retirement healthcare benefits have also been determined in accordance with the
applicable accounting standard.
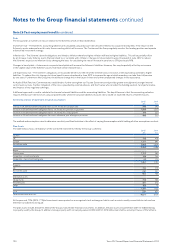
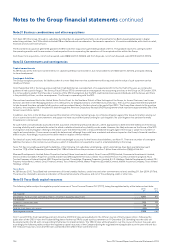
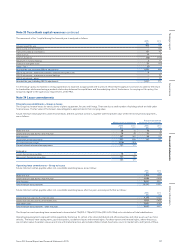
Principal assumptions
The major assumptions, on a weighted average basis, used by the actuaries were as follows:
2015
%
2014
%
Discount rate 3.7 4.7
Price inflation 3.1 3.3
Rate of increase in deferred pensions*2.1 2.3
Rate of increase in salaries 3.2 3.4
Rate of increase in pensions in payment*
Benefits accrued before 1 June 2012 2.9 3.1
Benefits accrued after 1 June 2012 2.1 2.3
Rate of increase in career average benefits
Benefits accrued before 1 June 2012 3.1 3.3
Benefits accrued after 1 June 2012 2.1 2.3
* In excess of any Guaranteed Minimum Pension (‘GMP’) element.
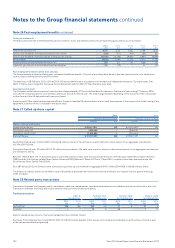
UK mortality assumptions
The Group conducts analysis of mortality trends under the Tesco PLC Pension Scheme in the UK as part of the triennial actuarial valuation of the Scheme.
At the latest triennial actuarial valuation as at 31 March 2014 the following assumptions were adopted for funding purposes:
Base tables:
95% of the SAPS S2 normal male pensioners for male staff and 80% of the SAPS S2 normal light male pensioners for male senior managers.
SAPS S2 all female pensioners with multipliers of 100% for female staff and 80% for female senior managers.
These assumptions were used for the calculation of the pension liability as at 28 February 2015 for the main UK scheme.
The mortality assumptions used are based on tables that have been projected to 2014 with CMI 2013 improvements. In addition, the allowance for future
mortality improvements from 2014 is in line with CMI 2013 with a long term improvement rate of 1.25% per annum.
The following table illustrates the expectation of life of an average member retiring at age 65 at the reporting date and a member reaching age 65 at reporting
date +25 years.
2015
Years
2014
Years
Retiring at reporting date at age 65: Male 23.0 22.9
Female 24.4 24.4
Retiring at reporting date +25 years at age 65: Male 25.3 25.2
Female 26.7 26.6
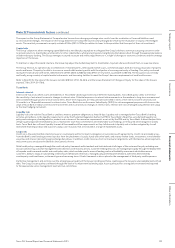
Note 26 Post-employment benefits continued
129Tesco PLC Annual Report and Financial Statements 2015
Other informationGovernance Financial statementsStrategic report