Tesco 2015 Annual Report Download - page 129
Download and view the complete annual report
Please find page 129 of the 2015 Tesco annual report below. You can navigate through the pages in the report by either clicking on the pages listed below, or by using the keyword search tool below to find specific information within the annual report.-
 1
1 -
2
-
3
-
4
-
5
-
6
-
7
-
8
-
9
-
10
-
11
-
12
-
13
-
14
-
15
-
16
-
17
-
18
-
19
-
20
-
21
-
22
-
23
-
24
-
25
-
26
-
27
-
28
-
29
-
30
-
31
-
32
-
33
-
34
-
35
-
36
-
37
-
38
-
39
-
40
-
41
-
42
-
43
-
44
-
45
-
46
-
47
-
48
-
49
-
50
-
51
-
52
-
53
-
54
-
55
-
56
-
57
-
58
-
59
-
60
-
61
-
62
-
63
-
64
-
65
-
66
-
67
-
68
-
69
-
70
-
71
-
72
-
73
-
74
-
75
-
76
-
77
-
78
-
79
-
80
-
81
-
82
-
83
-
84
-
85
-
86
-
87
-
88
-
89
-
90
-
91
-
92
-
93
-
94
-
95
-
96
-
97
-
98
-
99
-
100
-
101
-
102
-
103
-
104
-
105
-
106
-
107
-
108
-
109
-
110
-
111
-
112
-
113
-
114
-
115
-
116
-
117
-
118
-
 119
119 -
 120
120 -
 121
121 -
 122
122 -
 123
123 -
 124
124 -
 125
125 -
 126
126 -
 127
127 -
 128
128 -
 129
129 -
 130
130 -
 131
131 -
 132
132 -
 133
133 -
 134
134 -
 135
135 -
 136
136 -
 137
137 -
 138
138 -
 139
139 -
140
-
141
-
142
-
143
-
144
-
145
-
146
-
147
-
148
-
149
-
150
-
151
-
152
-
153
-
154
-
155
-
156
-
157
-
158
-
159
-
160
 |
 |

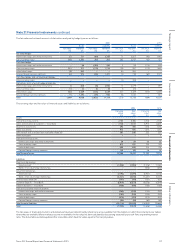
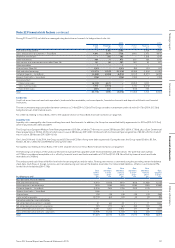
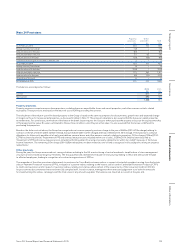
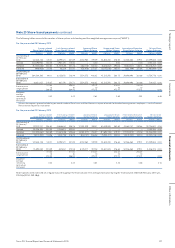
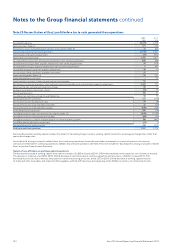
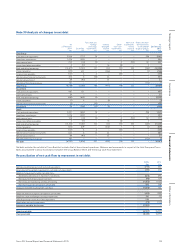
Note 25 Share-based payments continued
The following tables reconcile the number of share options outstanding and the weighted average exercise price (‘WAEP’):
For the year ended 28 February 2015
Savings-related
Share Option Scheme
Irish Savings-related
Share Option Scheme
Approved Share
Option Scheme
Unapproved Share
Option Scheme
International Executive
Share Option Scheme
Nil cost Share
Option Schemes*
Options WAEP Options WAEP Options WAEP Options WAEP Options WAEP Options WAEP
Outstanding at
22 February
2014 122,602,128 331. 31 4,899,521 331. 89 8,152,965 397.59 52,804,433 376.63 32,586,360 379.15 21,099,083 0.00
Granted 220,096,960 150.00 4,961,170 150.00 –0.00 –0.00 –0.00 5,105,144 0.00
Forfeited (57,445,888) 330.84 (1,731,520) 344.18 (482,116) 400.30 (4,616,552) 394.86 (2,667,321) 38 8.13 (13,018,757) 0.00
Exercised (948,908) 311.00 (6,521) 311.00 (136,476) 253.25 (2,875,288) 283.00 (822,049) 253.84 (1,460,694) 0.00
Outstanding at
28 February
2015 284,304,292 191.11 8,122,650 218.19 7,534,373 400.03 45,312,593 380.72 29,096,990 381.86 11,724,776 0.00
Exercisable at
28 February
2015 18,832,155 343.07 807,176 351.71 7,534,373 400.03 45,312,593 380.72 29,096,990 381.86 714,455 0.00
Exercise price
range (pence)
311.00
to
386.00
328.00
to
364.00
312.75
to
473.75
310.0 0
to
473.75
310.0 0
to
473.75 0.00
Weighted
average
remaining
contractual
life (years)
0.42 0.42 2.65 2.89 2.95 8.46
* Nil cost share options granted include buyout awards made to Dave Lewis and Alan Stewart in respect of awards forfeited on leaving previous employers – see the Directors
Remuneration Report for more detail.
For the year ended 22 February 2014
Savings-related
Share Option Scheme
Irish Savings-related
Share Option Scheme
Approved Share
Option Scheme
Unapproved Share
Option Scheme
International Executive
Share Option Scheme
Nil cost Share
Option Schemes
Options WAEP Options WAEP Options WAEP Options WAEP Options WAEP Options WAEP
Outstanding at
23 February
2013 127,212,551 338.85 4,886,834 338.78 12,592,329 399.01 80,439,020 382.62 53,665,107 387.64 19,778,825 0.00
Granted 29,258,434 322.00 1,294,873 322.00 – – – – – – 7,003,764 0.00
Forfeited (24,352,865) 365.89 (1,081,476) 353.68 ( 3,785,217) 418.07 (21,694,176) 419.27 (17,704,212) 415.76 (2,458,290) 0.00
Exercised (9,515,992) 314.96 (200,710) 318.29 (654,147) 306.38 (5,940,411) 302.00 (3,374,535) 322.10 (3,225,216) 0.00
Outstanding at
22 February
2014 122,602,128 331.31 4,899,521 331.89 8,152,965 397.59 52,804,433 376.63 32,586,360 379.15 21,099,083 0.00
Exercisable at
22 February
2014 15,894,484 353.09 837,652 370.38 8,145,517 397. 58 52,801,878 376.63 32,546,360 379.12 4,206,723 0.00
Exercise price
range (pence)
311.00
to
410.00
311.00
to
386.00
253.25
to
473.75
253.25
to
473.75
253.25
to
473.75 0.00
Weighted
average
remaining
contractual
life (years)
0.44 0.44 3.63 3.78 3.88 4.18
Share options were exercised on a regular basis throughout the financial year. The average share price during the financial year ended 28 February 2015 was
245.50p (2014: 349.48p).
127Tesco PLC Annual Report and Financial Statements 2015
Other informationGovernance Financial statementsStrategic report