Tesco 2015 Annual Report Download - page 18
Download and view the complete annual report
Please find page 18 of the 2015 Tesco annual report below. You can navigate through the pages in the report by either clicking on the pages listed below, or by using the keyword search tool below to find specific information within the annual report.-
 1
1 -
2
-
3
-
4
-
5
-
6
-
7
-
 8
8 -
 9
9 -
 10
10 -
 11
11 -
 12
12 -
 13
13 -
 14
14 -
 15
15 -
 16
16 -
 17
17 -
 18
18 -
 19
19 -
 20
20 -
 21
21 -
 22
22 -
 23
23 -
 24
24 -
 25
25 -
 26
26 -
 27
27 -
 28
28 -
29
-
30
-
31
-
32
-
33
-
34
-
35
-
36
-
37
-
38
-
39
-
40
-
41
-
42
-
43
-
44
-
45
-
46
-
47
-
48
-
49
-
50
-
51
-
52
-
53
-
54
-
55
-
56
-
57
-
58
-
59
-
60
-
61
-
62
-
63
-
64
-
65
-
66
-
67
-
68
-
69
-
70
-
71
-
72
-
73
-
74
-
75
-
76
-
77
-
78
-
79
-
80
-
81
-
82
-
83
-
84
-
85
-
86
-
87
-
88
-
89
-
90
-
91
-
92
-
93
-
94
-
95
-
96
-
97
-
98
-
99
-
100
-
101
-
102
-
103
-
104
-
105
-
106
-
107
-
108
-
109
-
110
-
111
-
112
-
113
-
114
-
115
-
116
-
117
-
118
-
119
-
120
-
121
-
122
-
123
-
124
-
125
-
126
-
127
-
128
-
129
-
130
-
131
-
132
-
133
-
134
-
135
-
136
-
137
-
138
-
139
-
140
-
141
-
142
-
143
-
144
-
145
-
146
-
147
-
148
-
149
-
150
-
151
-
152
-
153
-
154
-
155
-
156
-
157
-
158
-
159
-
160
 |
 |

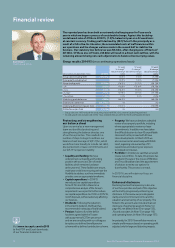
Financial review continued
Visit www.tescoplc.com/ar2015
to find PDF and Excel downloads
of our financial statements
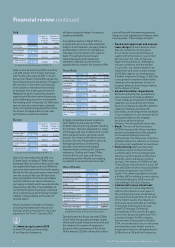
We opened 1.6m square feet of gross new
space in the year, but this was offset by the
closure of 1.1m sq. ft. of space, primarily
in Turkey and Hungary and the repurposing
of 0.6m sq. ft. of space, mainly in Asia.
We continue to grow our franchise store
network. In the year, we opened 1m sq. ft.
of space in our franchise stores, mostly in
South Korea, and are planning to open
a further 0.6m sq. ft. this year.
Property
As at the year end, the estimated market
value of fully-owned property across the
Group was £22.9bn. This represents a
reduction of £7.6bn year-on-year driven
mainly by the weakening of the UK and
Central European property markets. This
represents an estimated surplus of £2.7bn
over the net book value.
The estimated market value excludes
our share of property joint ventures.
Including this, the valuation would increase
by £0.9bn, net of the debt in the joint
ventures. Last year’s disclosed property
valuation of £34.1bn included £1.2bn
relating to our Chinese operations now
disposed to our joint venture and £2.4bn
from our share of joint venture property,
before deducting debt.
In March 2015, the British Land asset swap
added a further £0.7bn to the value of
our property as we took ownership of 21
superstores. Including this increase, our
Group freehold ownership percentage is
now 55% by value and 60% by selling space.
UK Asia Europe Group
Property* –
wholly owned
–Estimated
market value £10.5bn £8.3bn £4.1bn £22.9bn
–Net book value** £10.5bn £6.1bn £3.7bn £20.2bn
Proportion of
owned net
selling space 41% 66% 75% 59%
Proportion of
owned space
by value*** 40% 71% 74% 53%
* Stores, malls, investment properties, offices,
Distribution Centres, fixtures and fittings and WIP.
Excludes JVs.
** Property, plant and equipment excluding vehicles.
*** Excluding fixtures and fittings.
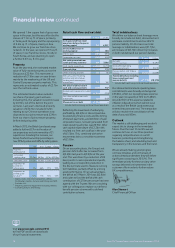
Retail cash flow and net debt
TY £m LY £m
Cash generated from retail
operations before changes in
working capital*715 4,327
(Increase)/decrease in
working capital 1,145 280
Interest paid (609) (490)
Corporation tax paid (347) (612)
Net cash generated from
retail operating activities 904 3,505
Cash capital expenditure (2,244) (2,774)
Free cash flow (1,340) 731
Other investing activities 253 66
Net cash used in financing
activities and intra-Group
funding and intercompany
transactions 239 160
Net (decrease)/increase in
cash and cash equivalents (848) 957
Exclude cash movements in debt
items (1,010) ( 374)
Fair value and other non-cash
movements (26) (583)
Movement in net debt (1,884) –
* Includes both continuing and discontinued operations.
Reflecting the lower level of underlying
profitability, £(0.6)bn in interest paid due
to underlying finance costs and the timing
of interest payments, and £(0.3)bn of cash
corporation taxes, net cash generated from
retail operating activities was £0.9bn. After
cash capital expenditure of £(2.2)bn this
resulted in a free cash outflow in the year
of £(1.3)bn. This, combined with other
movements led to a net debt movement
of £(1.9)bn.
Pension
On an accounting basis, the Group’s net
pension deficit after tax increased from
£(2.6)bn last year to £(3.9)bn at the year
end. This was driven by a reduction of 80
basis points in real corporate bond yields,
leading to a corresponding reduction in
the discount rate used to measure our long
term liabilities, partially offset by a strong
asset performance. On an actuarial basis,
the deficit at 31 March 2014 was £(2.8)bn
and a plan to fund the deficit with cash
contributions of £270m per annum has been
agreed with the Trustee. We are consulting
with our colleagues to replace our defined
benefit pension scheme with a defined
contribution scheme.
Total indebtedness
We define our balance sheet leverage more
broadly to include net debt, discounted rent
and lease commitments and our IAS 19
pension liability. On this basis our total
leverage or indebtedness was £(21.7)bn,
an increase of £(3.1)bn driven by increases
in both net debt and our pension liability.
TY £m LY £m
Net debt*
(excludes Tesco Bank) (8,481) (6,597)
Discounted operating
lease commitments (9,353) (9,419)
Pension deficit, IAS 19 basis
(post-tax) (3,885) (2,559)
Total indebtedness (including
lease commitments and
pension deficit) (21,719) (18,575)
* Includes both continuing and discontinued operations.
Our discounted minimum operating lease
commitments were broadly unchanged at
£(9.4)bn, whilst our operating lease expense
in the year increased by £72m to £1,486m.
Around £35m of this expense related to
inflation-indexed rent which will not recur
as a result of the British Land asset swap
entered into post year end. The transaction
will also result in the consolidation of net
debt of around £450m.
Outlook
The market is still challenging and we don’t
expect this to change in the immediate
future. Over the next 12 months we will
continue to focus on our three priorities:
regaining competitiveness in our UK
business; protecting and strengthening
the balance sheet; and rebuilding trust and
transparency in the business and the brand.
We are already making good progress
on these initiatives and on the basis of
actions already undertaken they will deliver
significant cost savings in 2015/16. The
immediate priority for these and any other
savings delivered is reinvestment in the
customer offer in order to further restore
UK competitiveness.
Alan Stewart
Chief Financial Officer
16 Tesco PLC Annual Report and Financial Statements 2015