Tesco 2015 Annual Report Download - page 153
Download and view the complete annual report
Please find page 153 of the 2015 Tesco annual report below. You can navigate through the pages in the report by either clicking on the pages listed below, or by using the keyword search tool below to find specific information within the annual report.-
 1
1 -
2
-
3
-
4
-
5
-
6
-
7
-
8
-
9
-
10
-
11
-
12
-
13
-
14
-
15
-
16
-
17
-
18
-
19
-
20
-
21
-
22
-
23
-
24
-
25
-
26
-
27
-
28
-
29
-
30
-
31
-
32
-
33
-
34
-
35
-
36
-
37
-
38
-
39
-
40
-
41
-
42
-
43
-
44
-
45
-
46
-
47
-
48
-
49
-
50
-
51
-
52
-
53
-
54
-
55
-
56
-
57
-
58
-
59
-
60
-
61
-
62
-
63
-
64
-
65
-
66
-
67
-
68
-
69
-
70
-
71
-
72
-
73
-
74
-
75
-
76
-
77
-
78
-
79
-
80
-
81
-
82
-
83
-
84
-
85
-
86
-
87
-
88
-
89
-
90
-
91
-
92
-
93
-
94
-
95
-
96
-
97
-
98
-
99
-
100
-
101
-
102
-
103
-
104
-
105
-
106
-
107
-
108
-
109
-
110
-
111
-
112
-
113
-
114
-
115
-
116
-
117
-
118
-
119
-
120
-
121
-
122
-
123
-
124
-
125
-
126
-
127
-
128
-
129
-
130
-
131
-
132
-
133
-
134
-
135
-
136
-
137
-
138
-
139
-
140
-
141
-
142
-
 143
143 -
 144
144 -
 145
145 -
 146
146 -
 147
147 -
 148
148 -
 149
149 -
 150
150 -
 151
151 -
 152
152 -
 153
153 -
 154
154 -
 155
155 -
 156
156 -
 157
157 -
 158
158 -
 159
159 -
 160
160
 |
 |

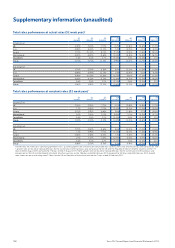
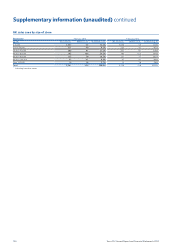
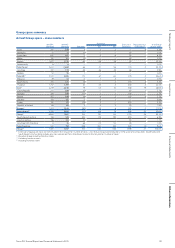
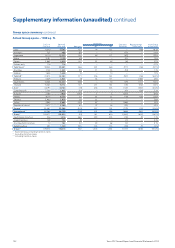
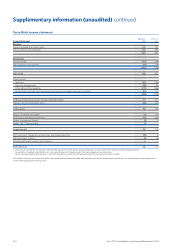
Actual Group space – store numbers
2013/14
year end
2014/15
year end Net gain
Openings Closures /
Disposals
Repurposing /
Extensions(a)
% of Group
at year end(b)
H1 H2
Extra 247 250 3 1 2 – 4 3.2%
Homeplus 12 11 (1) – – (1) –0.1%
Superstore 482 487 5 2 6 (3) –6.2%
Metro 195 191 (4) – – (4) –2.5%
Express 1,672 1,735 63 38 28 (3) –22.2%
Dotcom only 66– – – – – 0.1%
Total Tesco(c) 2,614 2,680 66 41 36 (11) 434.3%
One Stop 722 770 48 26 28 (6) –9.9%
Dobbies 34 35 1 – 1 – – 0.4%
Total UK(c) 3,370 3,485 115 67 65 (17) 444.6%
Malaysia 49 54 5 1 4 – 7 0.7%
South Korea 433 425 (8) – 2 (11) 85.4%
Thailand 1,737 1,759 22 53 4(35) 422.5%
Asia(c) 2,219 2,238 19 54 10 (46) 19 28.6%
Czech Republic 211 209 (2) – – (2) 12.7%
Hungary 220 209 (11) 1 1 (13) –2.7%
Poland 455 449 (6) 4 3 (13) 45.7%
Slovakia 150 155 5 4 1 – – 2.0%
Turkey 192 173 (19) 3 – (22) –2.2%
Republic of Ireland 146 149 3 2 3 (2) –1.9%
Europe(c) 1,374 1,344 (30) 14 8(52) 517.2%
International(c) 3,593 3,582 (11) 68 18 (98) 24 45.8%
Group(c) 6,963 7,0 67 104 135 83 (115) 28 90.4%
South Korea Franchise 198 543 345 178 193 (25) (1) 6.9%
Czech Franchise 136 131 (5) – – (5) –1.7%
One Stop (UK) Franchise 8 76 68 22 50 (4) –1.0%
Total Franchise 342 750 408 200 243 (34) (1) 9.6%
Group(d) 7,305 7,817 512 335 326 (149) 27 100.0%
(a) Extensions/repurposed stores are not included in the net gain for ‘number of stores’, since they are expansions/reductions in the space of existing stores. South Korea and
South Korea Franchise totals include one store conversion that is therefore included in the net gain for ‘number of stores’.
(b) Based on Group including franchise stores.
(c) Excluding franchise stores.
(d) Including franchise stores.
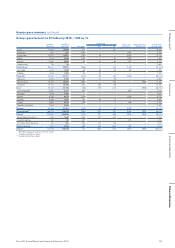
Group space summary
151Tesco PLC Annual Report and Financial Statements 2015
Other informationGovernance Financial statementsStrategic report