Supercuts 2008 Annual Report Download - page 91
Download and view the complete annual report
Please find page 91 of the 2008 Supercuts annual report below. You can navigate through the pages in the report by either clicking on the pages listed below, or by using the keyword search tool below to find specific information within the annual report.-
 1
1 -
2
-
3
-
4
-
5
-
6
-
7
-
8
-
9
-
10
-
11
-
12
-
13
-
14
-
15
-
16
-
17
-
18
-
19
-
20
-
21
-
22
-
23
-
24
-
25
-
26
-
27
-
28
-
29
-
30
-
31
-
32
-
33
-
34
-
35
-
36
-
37
-
38
-
39
-
40
-
41
-
42
-
43
-
44
-
45
-
46
-
47
-
48
-
49
-
50
-
51
-
52
-
53
-
54
-
55
-
56
-
57
-
58
-
59
-
60
-
61
-
62
-
63
-
64
-
65
-
66
-
67
-
68
-
69
-
70
-
71
-
72
-
73
-
74
-
75
-
76
-
77
-
78
-
79
-
80
-
 81
81 -
 82
82 -
 83
83 -
 84
84 -
 85
85 -
 86
86 -
 87
87 -
 88
88 -
 89
89 -
 90
90 -
 91
91 -
 92
92 -
 93
93 -
 94
94 -
 95
95 -
 96
96 -
 97
97 -
 98
98 -
 99
99 -
 100
100 -
 101
101 -
102
-
103
-
104
-
105
-
106
-
107
-
108
-
109
-
110
-
111
-
112
-
113
-
114
-
115
-
116
-
117
-
118
-
119
-
120
-
121
-
122
-
123
-
124
-
125
-
126
-
127
-
128
-
129
-
130
-
131
-
132
-
133
-
134
-
135
-
136
-
137
-
138
-
139
-
140
-
141
-
142
-
143
-
144
-
145
-
146
-
147
-
148
-
149
-
150
-
151
-
152
-
153
-
154
-
155
-
156
-
157
-
158
-
159
-
160
-
161
-
162
-
163
-
164
-
165
-
166
-
167
-
168
-
169
-
170
-
171
-
172
-
173
-
174
-
175
-
176
-
177
-
178
-
179
-
180
-
181
-
182
-
183
-
184
-
185
-
186
-
187
-
188
-
189
-
190
-
191
-
192
-
193
-
194
-
195
-
196
-
197
-
198
-
199
-
200
-
201
-
202
-
203
-
204
-
205
-
206
-
207
-
208
-
209
-
210
-
211
-
212
-
213
-
214
-
215
-
216
-
217
-
218
-
219
-
220
-
221
-
222
-
223
-
224
-
225
-
226
-
227
-
228
-
229
-
230
-
231
-
232
-
233
-
234
-
235
-
236
-
237
-
238
-
239
-
240
-
241
-
242
-
243
-
244
-
245
-
246
-
247
-
248
-
249
-
250
-
251
-
252
-
253
-
254
-
255
-
256
-
257
-
258
-
259
-
260
-
261
-
262
-
263
-
264
-
265
-
266
-
267
-
268
-
269
-
270
-
271
-
272
-
273
-
274
-
275
-
276
-
277
-
278
-
279
-
280
-
281
-
282
-
283
-
284
-
285
 |
 |

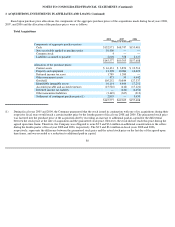
NOTES TO CONSOLIDATED FINANCIAL STATEMENTS (Continued)
3. ACQUISITIONS, INVESTMENTS IN AFFILIATES AND LOANS (Continued)
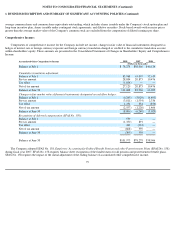
Investment in Affiliates and Loans
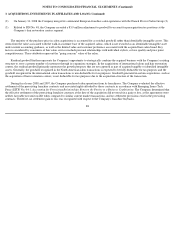
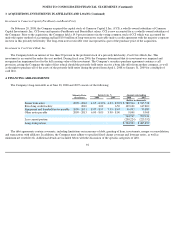
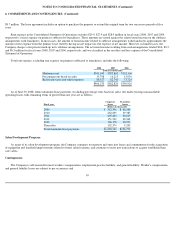
The table below presents the carrying amount of investments in affiliates as of June 30, 2008 and 2007:
(1)
Provalliance
Empire
Education
Group, Inc.
Intelligent
Nutrients, LLC
MY Style
(1)
PureBeauty/
BeautyFirst
(2)
Total
(Dollars in thousands)
Balance at June 30, 2007
$
—
$
—
$
8,114
$
8,080
$
4,019
$
20,213
Investment acquired
109,915
72,337
—
—
—
182,252
Acquisition of remaining interest
—
—
—
—
(
3,883
)
(3,883
)
Equity in income (loss) of affiliated companies, net of income
taxes
1,767
802
(1,584
)
—
(
136
)
849
Other, primarily translation rate adjustments
7,671
(232
)
(873
)
(2,291
)
—
4,275
Balance at June 30, 2008
$
119,353
$
72,907
$
5,657
$
5,789
$
—
$
203,706
Percentage ownership at June 30, 2008
30.0
%
55.1
%
49.0
%
14.8
%
MyStyle is a cost method investment, therefore the Company does not record its portion of MY Style's earnings or losses.
(2)
In February 2008, the Company acquired 100% interest in this entity and no longer accounts PureBeauty as an equity method investment.
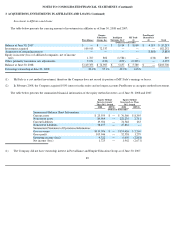
The table below presents the summarized financial information of the equity method investees as of June 30, 2008 and 2007.
(1)
Equity Method
Investee Greater
Than 50% Owned
Equity Method
Investees Less Than
50% Owned
2008
2007(1)
2008
2007(1)
(Dollars in thousands)
Summarized Balance Sheet Information:
Current assets
$
23,559
$
—
$
76,360
$
8,395
Noncurrent assets
89,964
—
222,235
2,711
Current liabilities
19,924
—
74,548
263
Noncurrent liabilities
38,457
—
47,832
—
Summarized Statement of Operations Information:
Gross revenue
$
119,076
$
—
$
153,426
$
2,269
Gross profit
105,946
—
52,538
1,279
Operating income (loss)
4,322
—
6,655
(2,818
)
Net income (loss)
1,725
—
1,962
(2,671
)
The Company did not have ownership interest in Provalliance and Empire Education Group as of June 30, 2007.
89