Supercuts 2008 Annual Report Download - page 45
Download and view the complete annual report
Please find page 45 of the 2008 Supercuts annual report below. You can navigate through the pages in the report by either clicking on the pages listed below, or by using the keyword search tool below to find specific information within the annual report.-
 1
1 -
2
-
3
-
4
-
5
-
6
-
7
-
8
-
9
-
10
-
11
-
12
-
13
-
14
-
15
-
16
-
17
-
18
-
19
-
20
-
21
-
22
-
23
-
24
-
25
-
26
-
27
-
28
-
29
-
30
-
31
-
32
-
33
-
34
-
 35
35 -
 36
36 -
 37
37 -
 38
38 -
 39
39 -
 40
40 -
 41
41 -
 42
42 -
 43
43 -
 44
44 -
 45
45 -
 46
46 -
 47
47 -
 48
48 -
 49
49 -
 50
50 -
 51
51 -
 52
52 -
 53
53 -
 54
54 -
 55
55 -
56
-
57
-
58
-
59
-
60
-
61
-
62
-
63
-
64
-
65
-
66
-
67
-
68
-
69
-
70
-
71
-
72
-
73
-
74
-
75
-
76
-
77
-
78
-
79
-
80
-
81
-
82
-
83
-
84
-
85
-
86
-
87
-
88
-
89
-
90
-
91
-
92
-
93
-
94
-
95
-
96
-
97
-
98
-
99
-
100
-
101
-
102
-
103
-
104
-
105
-
106
-
107
-
108
-
109
-
110
-
111
-
112
-
113
-
114
-
115
-
116
-
117
-
118
-
119
-
120
-
121
-
122
-
123
-
124
-
125
-
126
-
127
-
128
-
129
-
130
-
131
-
132
-
133
-
134
-
135
-
136
-
137
-
138
-
139
-
140
-
141
-
142
-
143
-
144
-
145
-
146
-
147
-
148
-
149
-
150
-
151
-
152
-
153
-
154
-
155
-
156
-
157
-
158
-
159
-
160
-
161
-
162
-
163
-
164
-
165
-
166
-
167
-
168
-
169
-
170
-
171
-
172
-
173
-
174
-
175
-
176
-
177
-
178
-
179
-
180
-
181
-
182
-
183
-
184
-
185
-
186
-
187
-
188
-
189
-
190
-
191
-
192
-
193
-
194
-
195
-
196
-
197
-
198
-
199
-
200
-
201
-
202
-
203
-
204
-
205
-
206
-
207
-
208
-
209
-
210
-
211
-
212
-
213
-
214
-
215
-
216
-
217
-
218
-
219
-
220
-
221
-
222
-
223
-
224
-
225
-
226
-
227
-
228
-
229
-
230
-
231
-
232
-
233
-
234
-
235
-
236
-
237
-
238
-
239
-
240
-
241
-
242
-
243
-
244
-
245
-
246
-
247
-
248
-
249
-
250
-
251
-
252
-
253
-
254
-
255
-
256
-
257
-
258
-
259
-
260
-
261
-
262
-
263
-
264
-
265
-
266
-
267
-
268
-
269
-
270
-
271
-
272
-
273
-
274
-
275
-
276
-
277
-
278
-
279
-
280
-
281
-
282
-
283
-
284
-
285
 |
 |

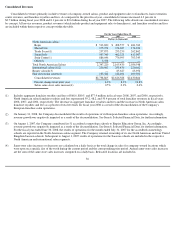
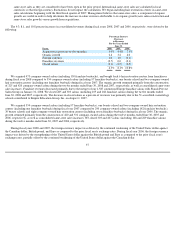
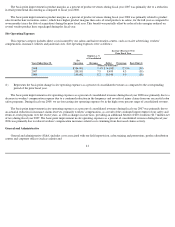
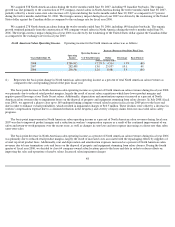
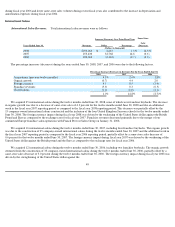
The basis point increase in rent expense as a percent of consolidated revenues during fiscal years 2007 and 2006 was primarily due to rent
expense increasing at a faster rate than location same-store sales. Additionally, fiscal year 2007 is impacted by an extra week of rent in the
United Kingdom.
During fiscal year 2006, $4.1 million in lease termination costs were recognized through rent expense. These costs resulted from our
decision to close 64 company-owned salon locations and refocus efforts on improving the sales and operations of nearby salons. Additionally,
the increase in this fixed-cost expense as a percent of consolidated revenues was due to salon rent increasing at a faster rate than salon same-
store sales during fiscal year 2006.
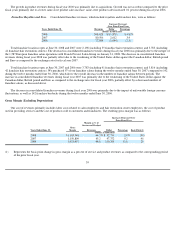
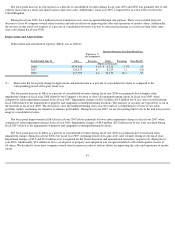
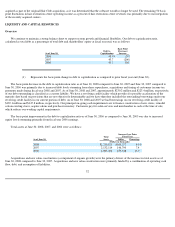
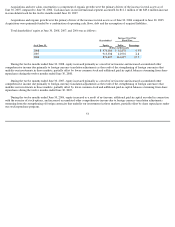
Depreciation and Amortization
Depreciation and amortization expense (D&A) was as follows:
(1)
Increase (Decrease) Over Prior Fiscal Year
Periods Ended June 30, D&A
Expense as %
of Consolidated
Revenues Dollar
Percentage
Basis Point(1)
(Dollars in thousands)
2008
$
130,448
4.8
%
$
6,311
5.1
%
10
2007
124,137
4.7
8,234
7.1
(10
)
2006
115,903
4.8
24,150
26.3
60
Represents the basis point change in depreciation and amortization as a percent of consolidated revenues as compared to the
corresponding period of the prior fiscal year.
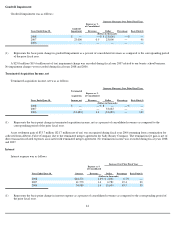
The basis point increase in D&A as a percent of consolidated revenues during fiscal year 2008 was primarily due to higher salon
impairment charges in fiscal year 2008 related to the Company's decision to close 160 underperforming salons in fiscal year 2009, when
compared to salon impairment charges in fiscal year 2007. Impairment charges of $10.5 million ($6.4 million net of tax) were recorded during
fiscal 2008 related to the impairment of property and equipment at underperforming locations. The majority of closings are expected to occur in
the first half of fiscal year 2009. The decision to close the underperforming stores was the result of a comprehensive review of our salon
portfolio, further continuing our initiative to enhance profitability. During fiscal year 2009, we are forecasting D&A to be in the mid four percent
range of consolidated revenue.
The basis point improvement in D&A for fiscal year 2007 relates primarily to lower salon impairment charges in fiscal year 2007 when
compared to salon impairment charges in fiscal year 2006. Impairment charges of $6.8 million ($4.3 million net of tax) were recorded during
fiscal 2007 related to the impairment of property and equipment at underperforming locations.
The basis point increase in D&A as a percent of consolidated revenues during fiscal year 2006 was primarily due to increased salon
impairment charges during fiscal year 2006 over fiscal year 2005, stemming from lower same-store sales volumes during recent fiscal years.
Impairment charges of $7.4 and $1.0 million were recognized for the North American and international operations, respectively, during fiscal
year 2006. Additionally, $2.4 million in losses on disposal of property and equipment was recognized related to the fourth quarter closure of
64 salons. We decided to close these company-owned salon locations in order to refocus efforts on improving the sales and operations of nearby
salons.
43