Supercuts 2008 Annual Report Download - page 116
Download and view the complete annual report
Please find page 116 of the 2008 Supercuts annual report below. You can navigate through the pages in the report by either clicking on the pages listed below, or by using the keyword search tool below to find specific information within the annual report.-
 1
1 -
2
-
3
-
4
-
5
-
6
-
7
-
8
-
9
-
10
-
11
-
12
-
13
-
14
-
15
-
16
-
17
-
18
-
19
-
20
-
21
-
22
-
23
-
24
-
25
-
26
-
27
-
28
-
29
-
30
-
31
-
32
-
33
-
34
-
35
-
36
-
37
-
38
-
39
-
40
-
41
-
42
-
43
-
44
-
45
-
46
-
47
-
48
-
49
-
50
-
51
-
52
-
53
-
54
-
55
-
56
-
57
-
58
-
59
-
60
-
61
-
62
-
63
-
64
-
65
-
66
-
67
-
68
-
69
-
70
-
71
-
72
-
73
-
74
-
75
-
76
-
77
-
78
-
79
-
80
-
81
-
82
-
83
-
84
-
85
-
86
-
87
-
88
-
89
-
90
-
91
-
92
-
93
-
94
-
95
-
96
-
97
-
98
-
99
-
100
-
101
-
102
-
103
-
104
-
105
-
 106
106 -
 107
107 -
 108
108 -
 109
109 -
 110
110 -
 111
111 -
 112
112 -
 113
113 -
 114
114 -
 115
115 -
 116
116 -
 117
117 -
 118
118 -
 119
119 -
 120
120 -
 121
121 -
 122
122 -
 123
123 -
 124
124 -
 125
125 -
 126
126 -
127
-
128
-
129
-
130
-
131
-
132
-
133
-
134
-
135
-
136
-
137
-
138
-
139
-
140
-
141
-
142
-
143
-
144
-
145
-
146
-
147
-
148
-
149
-
150
-
151
-
152
-
153
-
154
-
155
-
156
-
157
-
158
-
159
-
160
-
161
-
162
-
163
-
164
-
165
-
166
-
167
-
168
-
169
-
170
-
171
-
172
-
173
-
174
-
175
-
176
-
177
-
178
-
179
-
180
-
181
-
182
-
183
-
184
-
185
-
186
-
187
-
188
-
189
-
190
-
191
-
192
-
193
-
194
-
195
-
196
-
197
-
198
-
199
-
200
-
201
-
202
-
203
-
204
-
205
-
206
-
207
-
208
-
209
-
210
-
211
-
212
-
213
-
214
-
215
-
216
-
217
-
218
-
219
-
220
-
221
-
222
-
223
-
224
-
225
-
226
-
227
-
228
-
229
-
230
-
231
-
232
-
233
-
234
-
235
-
236
-
237
-
238
-
239
-
240
-
241
-
242
-
243
-
244
-
245
-
246
-
247
-
248
-
249
-
250
-
251
-
252
-
253
-
254
-
255
-
256
-
257
-
258
-
259
-
260
-
261
-
262
-
263
-
264
-
265
-
266
-
267
-
268
-
269
-
270
-
271
-
272
-
273
-
274
-
275
-
276
-
277
-
278
-
279
-
280
-
281
-
282
-
283
-
284
-
285
 |
 |

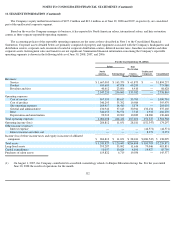
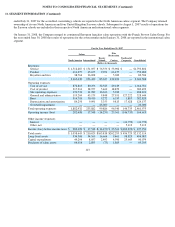
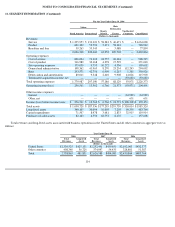
NOTES TO CONSOLIDATED FINANCIAL STATEMENTS (Continued)
11. SEGMENT INFORMATION (Continued)
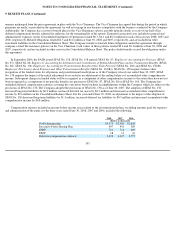
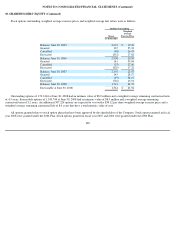
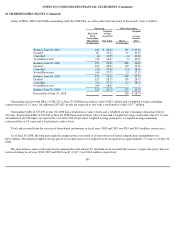
Total revenues and long-lived assets associated with business operations in the United States and all other countries in aggregate were as
follows:
114
For the Year Ended June 30, 2006
Salons
Beauty
Schools
Hair
Restoration
Centers
Unallocated
Corporate
North America
International
Consolidated
(Dollars in thousands)
Revenues:
Service
$
1,395,953
$
133,323
$
58,281
$
46,471
$
—
$
1,634,028
Product
601,332
53,796
5,671
58,143
—
718,942
Royalties and fees
39,263
33,543
—
5,088
—
77,894
2,036,548
220,662
63,952
109,702
—
2,430,864
Operating expenses:
Cost of service
806,024
71,110
24,757
26,624
—
928,515
Cost of product
316,980
32,168
4,278
17,592
—
371,018
Site operating expenses
175,039
9,755
10,272
4,536
—
199,602
General and administrative
108,362
41,963
8,270
23,254
112,243
294,092
Rent
293,571
42,756
6,999
6,215
1,385
350,926
Depreciation and amortization
80,011
9,348
2,610
9,908
14,026
115,903
Terminated acquisition income, net
—
—
—
—
(
33,683
)
(33,683
)
Total operating expenses
1,779,987
207,100
57,186
88,129
93,971
2,226,373
Operating income (loss)
256,561
13,562
6,766
21,573
(93,971
)
204,491
Other income (expense):
Interest
—
—
—
—
(
34,989
)
(34,989
)
Other, net
—
—
—
—
651
651
Income (loss) before income taxes
$
256,561
$
13,562
$
6,766
$
21,573
$
(128,309
)
$
170,153
Total assets
$
1,030,720
$
187,556
$
177,295
$
259,739
$
330,014
$
1,985,324
Long
-
lived assets
340,105
30,094
16,003
7,203
90,359
483,764
Capital expenditures
71,507
8,978
3,681
2,833
32,915
119,914
Purchases of salon assets
82,123
4,556
62,753
8,176
—
157,608
Year Ended June 30,
2008 2007 2006
Total
Revenues
Long-
lived
Assets
Total
Revenues
Long-
lived
Assets
Total
Revenues
Long-
lived
Assets
(Dollars in thousands)
United States
$
2,330,525
$
425,131
$
2,252,491
$
439,650
$
2,102,063
$
432,377
Other countries
408,340
56,720
374,097
54,435
328,801
51,387
Total
2,738,865
481,851
$
2,626,588
$
494,085
$
2,430,864
$
483,764