Supercuts 2008 Annual Report Download - page 117
Download and view the complete annual report
Please find page 117 of the 2008 Supercuts annual report below. You can navigate through the pages in the report by either clicking on the pages listed below, or by using the keyword search tool below to find specific information within the annual report.-
 1
1 -
2
-
3
-
4
-
5
-
6
-
7
-
8
-
9
-
10
-
11
-
12
-
13
-
14
-
15
-
16
-
17
-
18
-
19
-
20
-
21
-
22
-
23
-
24
-
25
-
26
-
27
-
28
-
29
-
30
-
31
-
32
-
33
-
34
-
35
-
36
-
37
-
38
-
39
-
40
-
41
-
42
-
43
-
44
-
45
-
46
-
47
-
48
-
49
-
50
-
51
-
52
-
53
-
54
-
55
-
56
-
57
-
58
-
59
-
60
-
61
-
62
-
63
-
64
-
65
-
66
-
67
-
68
-
69
-
70
-
71
-
72
-
73
-
74
-
75
-
76
-
77
-
78
-
79
-
80
-
81
-
82
-
83
-
84
-
85
-
86
-
87
-
88
-
89
-
90
-
91
-
92
-
93
-
94
-
95
-
96
-
97
-
98
-
99
-
100
-
101
-
102
-
103
-
104
-
105
-
106
-
 107
107 -
 108
108 -
 109
109 -
 110
110 -
 111
111 -
 112
112 -
 113
113 -
 114
114 -
 115
115 -
 116
116 -
 117
117 -
 118
118 -
 119
119 -
 120
120 -
 121
121 -
 122
122 -
 123
123 -
 124
124 -
 125
125 -
 126
126 -
 127
127 -
128
-
129
-
130
-
131
-
132
-
133
-
134
-
135
-
136
-
137
-
138
-
139
-
140
-
141
-
142
-
143
-
144
-
145
-
146
-
147
-
148
-
149
-
150
-
151
-
152
-
153
-
154
-
155
-
156
-
157
-
158
-
159
-
160
-
161
-
162
-
163
-
164
-
165
-
166
-
167
-
168
-
169
-
170
-
171
-
172
-
173
-
174
-
175
-
176
-
177
-
178
-
179
-
180
-
181
-
182
-
183
-
184
-
185
-
186
-
187
-
188
-
189
-
190
-
191
-
192
-
193
-
194
-
195
-
196
-
197
-
198
-
199
-
200
-
201
-
202
-
203
-
204
-
205
-
206
-
207
-
208
-
209
-
210
-
211
-
212
-
213
-
214
-
215
-
216
-
217
-
218
-
219
-
220
-
221
-
222
-
223
-
224
-
225
-
226
-
227
-
228
-
229
-
230
-
231
-
232
-
233
-
234
-
235
-
236
-
237
-
238
-
239
-
240
-
241
-
242
-
243
-
244
-
245
-
246
-
247
-
248
-
249
-
250
-
251
-
252
-
253
-
254
-
255
-
256
-
257
-
258
-
259
-
260
-
261
-
262
-
263
-
264
-
265
-
266
-
267
-
268
-
269
-
270
-
271
-
272
-
273
-
274
-
275
-
276
-
277
-
278
-
279
-
280
-
281
-
282
-
283
-
284
-
285
 |
 |

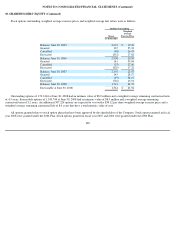
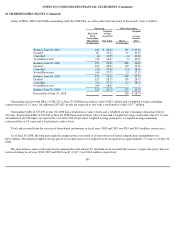
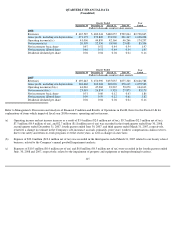
QUARTERLY FINANCIAL DATA
(Unaudited)
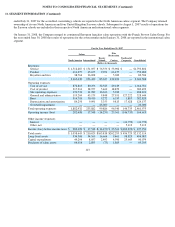
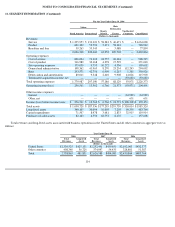
Refer to Management's Discussion and Analysis of Financial Condition and Results of Operations in Part II, Item 6 in this Form 10-K for
explanations of items which impacted fiscal year 2008 revenues, operating and net income.
(a)
Quarter Ended
Year
Ended
September 30
December 31
March 31 June 30
(Dollars in thousands, except per share amounts)
2008
Revenues
$
667,525
$
682,241
$
680,055
$
709,044
$
2,738,865
Gross profit, including site depreciation
271,172
270,820
274,969
291,267
1,108,228
Operating income(a)(c)
41,006
44,859
42,166
46,266
174,297
Net income(a)(c)
20,599
22,556
18,968
23,081
85,204
Net income per basic share
0.47
0.52
0.44
0.54
1.97
Net income per diluted share
0.46
0.51
0.44
0.54
1.95
Dividends declared per share
0.04
0.04
0.04
0.04
0.16
Quarter Ended
Year
Ended
September 30
December 31
March 31
June 30
(Dollars in thousands, except per share amounts)
2007
Revenues
$
639,243
$
656,990
$
655,035
$
675,320
$
2,626,588
Gross profit, including site depreciation
262,460
269,368
269,096
278,619
1,079,543
Operating income(a)(b)(c)
44,016
47,260
23,267
50,070
164,613
Net income(a)(b)(c)
23,093
26,874
5,328
27,875
83,170
Net income per basic share
0.51
0.60
0.12
0.63
1.86
Net income per diluted share
0.50
0.59
0.12
0.61
1.82
Dividends declared per share
0.04
0.04
0.04
0.04
0.16
Operating income and net income increase as a result of $3.4 million ($2.0 million net of tax), $3.7 million ($2.3 million net of tax),
$7.5 million ($4.9 million of tax), and $2.7 million ($1.8 million net of tax) was recorded in the fourth quarter ended June 30, 2008,
second quarter ended December 31, 2007, fourth quarter ended June 30, 2007, and third quarter ended March 31, 2007, respectively,
related to a change in estimate in the Company's self-insurance accruals, primarily, prior years' workers' compensation claims reserves,
due to our safety and return-to-work programs over the recent years, as well as changes in state laws.
(b) Expense of $23.0 million ($19.6 million net of tax) was recorded in the third quarter ended March 31, 2007 related to our beauty school
business, related to the Company's annual goodwill impairment analysis.
(c) Expenses of $10.5 million ($6.4 million net of tax) and $6.8 million ($4.5 million net of tax) were recorded in the fourth quarters ended
June, 30, 2008 and 2007, respectively, related to the impairment of property and equipment at underperforming locations.
115