Supercuts 2008 Annual Report Download - page 51
Download and view the complete annual report
Please find page 51 of the 2008 Supercuts annual report below. You can navigate through the pages in the report by either clicking on the pages listed below, or by using the keyword search tool below to find specific information within the annual report.-
 1
1 -
2
-
3
-
4
-
5
-
6
-
7
-
8
-
9
-
10
-
11
-
12
-
13
-
14
-
15
-
16
-
17
-
18
-
19
-
20
-
21
-
22
-
23
-
24
-
25
-
26
-
27
-
28
-
29
-
30
-
31
-
32
-
33
-
34
-
35
-
36
-
37
-
38
-
39
-
40
-
 41
41 -
 42
42 -
 43
43 -
 44
44 -
 45
45 -
 46
46 -
 47
47 -
 48
48 -
 49
49 -
 50
50 -
 51
51 -
 52
52 -
 53
53 -
 54
54 -
 55
55 -
 56
56 -
 57
57 -
 58
58 -
 59
59 -
 60
60 -
 61
61 -
62
-
63
-
64
-
65
-
66
-
67
-
68
-
69
-
70
-
71
-
72
-
73
-
74
-
75
-
76
-
77
-
78
-
79
-
80
-
81
-
82
-
83
-
84
-
85
-
86
-
87
-
88
-
89
-
90
-
91
-
92
-
93
-
94
-
95
-
96
-
97
-
98
-
99
-
100
-
101
-
102
-
103
-
104
-
105
-
106
-
107
-
108
-
109
-
110
-
111
-
112
-
113
-
114
-
115
-
116
-
117
-
118
-
119
-
120
-
121
-
122
-
123
-
124
-
125
-
126
-
127
-
128
-
129
-
130
-
131
-
132
-
133
-
134
-
135
-
136
-
137
-
138
-
139
-
140
-
141
-
142
-
143
-
144
-
145
-
146
-
147
-
148
-
149
-
150
-
151
-
152
-
153
-
154
-
155
-
156
-
157
-
158
-
159
-
160
-
161
-
162
-
163
-
164
-
165
-
166
-
167
-
168
-
169
-
170
-
171
-
172
-
173
-
174
-
175
-
176
-
177
-
178
-
179
-
180
-
181
-
182
-
183
-
184
-
185
-
186
-
187
-
188
-
189
-
190
-
191
-
192
-
193
-
194
-
195
-
196
-
197
-
198
-
199
-
200
-
201
-
202
-
203
-
204
-
205
-
206
-
207
-
208
-
209
-
210
-
211
-
212
-
213
-
214
-
215
-
216
-
217
-
218
-
219
-
220
-
221
-
222
-
223
-
224
-
225
-
226
-
227
-
228
-
229
-
230
-
231
-
232
-
233
-
234
-
235
-
236
-
237
-
238
-
239
-
240
-
241
-
242
-
243
-
244
-
245
-
246
-
247
-
248
-
249
-
250
-
251
-
252
-
253
-
254
-
255
-
256
-
257
-
258
-
259
-
260
-
261
-
262
-
263
-
264
-
265
-
266
-
267
-
268
-
269
-
270
-
271
-
272
-
273
-
274
-
275
-
276
-
277
-
278
-
279
-
280
-
281
-
282
-
283
-
284
-
285
 |
 |

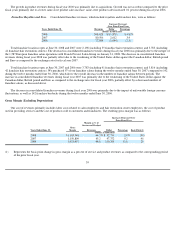
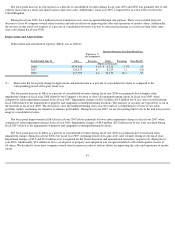
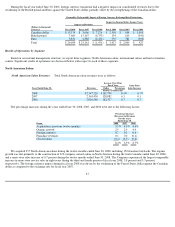
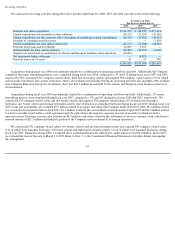
during fiscal year 2006 and lower same-store sales volumes during recent fiscal years also contributed to the increase in depreciation and
amortization expenses during fiscal year 2006.
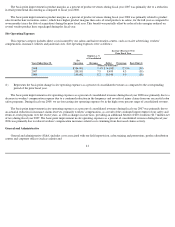
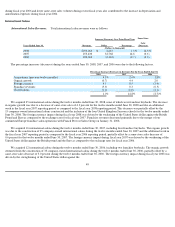
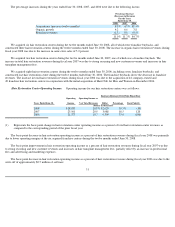
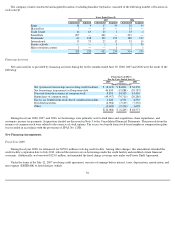
International Salons
International Salon Revenues. Total international salon revenues were as follows:
The percentage increases (decreases) during the years ended June 30, 2008, 2007, and 2006 were due to the following factors.
We acquired 25 international salons during the twelve months ended June 30, 2008, none of which were franchise buybacks. The decrease
in organic growth was due to a decrease of same-store sales of 4.3 percent for the twelve months ended June 30, 2008 and due an additional
week in the fiscal year 2007 reporting period as compared to the fiscal year 2008 reporting period. This decrease was partially offset by the
15 company-owned international salons constructed and the inclusion of the four United Kingdom Sassoon schools for the twelve months ended
June 30, 2008. The foreign currency impact during fiscal year 2008 was driven by the weakening of the United States dollar against the British
Pound and Euro as compared to the exchange rates for fiscal year 2007. Franchise revenues decreased primarily due to the merger of our
continental Europe franchise salon operations with Franck Provost Salon Group on January 31, 2008.
We acquired 16 international salons during the twelve months ended June 30, 2007, including four franchise buybacks. The organic growth
was due to the construction of 25 company-
owned international salons during the twelve months ended June 30, 2007 and the additional week in
the fiscal year 2007 reporting period as compared to the fiscal year 2006 reporting period, partially offset by a same-store sales decrease of
0.6 percent for the twelve months ended June 30, 2007. The foreign currency impact during fiscal year 2007 was driven by the weakening of the
United States dollar against the British pound and the Euro as compared to the exchange rates for fiscal year 2006.
We acquired 12 international salons during the twelve months ended June 30, 2006, including two franchise buybacks. The organic growth
stemmed from the construction of 33 company-owned international salons during the twelve months ended June 30, 2006, partially offset by a
same-
store sales decrease of 3.0 percent during the twelve months ended June 30, 2006. The foreign currency impact during fiscal year 2006 was
driven by the strengthening of the United States dollar against the
49
Increase (Decrease) Over Prior Fiscal Year
Same-
Store
Sales
(Decrease)
Years Ended June 30, Revenues Dollar Percentage
(Dollars in thousands)
2008
$
256,063
$
2,633
1.0
%
(4.3
)%
2007
253,430
32,768
14.8
(0.6
)
2006
220,662
(6,122
)
(2.7
)
(3.0
)
Percentage Increase (Decrease) in Revenues For the Years Ended June 30,
2008
2007
2006
Acquisitions (previous twelve months)
4.1
%
2.6
%
1.8
%
Organic growth
(0.7
)
4.4
2.0
Foreign currency
4.5
8.5
(3.9
)
Franchise revenues
(5.9
)
0.3
(0.5
)
Closed salons
(1.0
)
(1.0
)
(2.1
)
1.0
%
14.8
%
(2.7
)%