Supercuts 2008 Annual Report Download - page 37
Download and view the complete annual report
Please find page 37 of the 2008 Supercuts annual report below. You can navigate through the pages in the report by either clicking on the pages listed below, or by using the keyword search tool below to find specific information within the annual report.-
 1
1 -
2
-
3
-
4
-
5
-
6
-
7
-
8
-
9
-
10
-
11
-
12
-
13
-
14
-
15
-
16
-
17
-
18
-
19
-
20
-
21
-
22
-
23
-
24
-
25
-
26
-
 27
27 -
 28
28 -
 29
29 -
 30
30 -
 31
31 -
 32
32 -
 33
33 -
 34
34 -
 35
35 -
 36
36 -
 37
37 -
 38
38 -
 39
39 -
 40
40 -
 41
41 -
 42
42 -
 43
43 -
 44
44 -
 45
45 -
 46
46 -
 47
47 -
48
-
49
-
50
-
51
-
52
-
53
-
54
-
55
-
56
-
57
-
58
-
59
-
60
-
61
-
62
-
63
-
64
-
65
-
66
-
67
-
68
-
69
-
70
-
71
-
72
-
73
-
74
-
75
-
76
-
77
-
78
-
79
-
80
-
81
-
82
-
83
-
84
-
85
-
86
-
87
-
88
-
89
-
90
-
91
-
92
-
93
-
94
-
95
-
96
-
97
-
98
-
99
-
100
-
101
-
102
-
103
-
104
-
105
-
106
-
107
-
108
-
109
-
110
-
111
-
112
-
113
-
114
-
115
-
116
-
117
-
118
-
119
-
120
-
121
-
122
-
123
-
124
-
125
-
126
-
127
-
128
-
129
-
130
-
131
-
132
-
133
-
134
-
135
-
136
-
137
-
138
-
139
-
140
-
141
-
142
-
143
-
144
-
145
-
146
-
147
-
148
-
149
-
150
-
151
-
152
-
153
-
154
-
155
-
156
-
157
-
158
-
159
-
160
-
161
-
162
-
163
-
164
-
165
-
166
-
167
-
168
-
169
-
170
-
171
-
172
-
173
-
174
-
175
-
176
-
177
-
178
-
179
-
180
-
181
-
182
-
183
-
184
-
185
-
186
-
187
-
188
-
189
-
190
-
191
-
192
-
193
-
194
-
195
-
196
-
197
-
198
-
199
-
200
-
201
-
202
-
203
-
204
-
205
-
206
-
207
-
208
-
209
-
210
-
211
-
212
-
213
-
214
-
215
-
216
-
217
-
218
-
219
-
220
-
221
-
222
-
223
-
224
-
225
-
226
-
227
-
228
-
229
-
230
-
231
-
232
-
233
-
234
-
235
-
236
-
237
-
238
-
239
-
240
-
241
-
242
-
243
-
244
-
245
-
246
-
247
-
248
-
249
-
250
-
251
-
252
-
253
-
254
-
255
-
256
-
257
-
258
-
259
-
260
-
261
-
262
-
263
-
264
-
265
-
266
-
267
-
268
-
269
-
270
-
271
-
272
-
273
-
274
-
275
-
276
-
277
-
278
-
279
-
280
-
281
-
282
-
283
-
284
-
285
 |
 |

number of states' tax initiatives, negatively affected the tax rate by 1.9 percent. These events were partially offset by Work
Opportunity and Welfare-to-Work Tax Credits earned during the fiscal year, which caused a 2.0 percent decrease in the rate.
•
Site operating expenses were positively impacted by a $7.1 million ($4.3 million net of tax) change in estimate of the Company's
self-insurance accruals, primarily workers' compensation, due to the continued improvement of our safety and return-to-work
programs over the recent years as well as changes in state laws.
•
Earnings per share increased to $1.95 per diluted share, up from $1.82 per diluted share in fiscal year 2007, primarily related to
the schools goodwill impairment charge in fiscal year 2007.
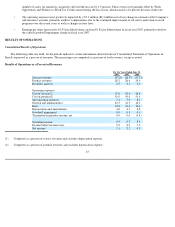
RESULTS OF OPERATIONS
Consolidated Results of Operations
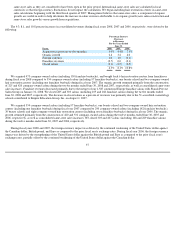
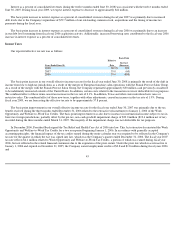
The following table sets forth, for the periods indicated, certain information derived from our Consolidated Statement of Operations in
Item 8, expressed as a percent of revenues. The percentages are computed as a percent of total revenues, except as noted.
Results of Operations as a Percent of Revenues
(1)
For the Years Ended June 30,
2008
2007
2006
Service revenues
69.2
%
68.3
%
67.2
%
Product revenues
28.3
28.6
29.6
Royalties and fees
2.5
3.1
3.2
Operating expenses:
Cost of service(1)
57.6
56.6
56.8
Cost of product(2)
51.0
50.6
51.6
Site operating expenses
7.4
7.9
8.2
General and administrative
12.3
12.5
12.1
Rent
14.8
14.6
14.4
Depreciation and amortization
4.8
4.7
4.8
Goodwill impairment
0.0
0.9
0.0
Terminated acquisition income, net
0.0
0.0
(1.4
)
Operating income
6.4
6.3
8.4
Income before income taxes
5.0
4.9
7.0
Net income
3.1
3.2
4.5
Computed as a percent of service revenues and excludes depreciation expense.
(2)
Computed as a percent of product revenues and excludes depreciation expense.
35