Supercuts 2008 Annual Report Download - page 74
Download and view the complete annual report
Please find page 74 of the 2008 Supercuts annual report below. You can navigate through the pages in the report by either clicking on the pages listed below, or by using the keyword search tool below to find specific information within the annual report.-
 1
1 -
2
-
3
-
4
-
5
-
6
-
7
-
8
-
9
-
10
-
11
-
12
-
13
-
14
-
15
-
16
-
17
-
18
-
19
-
20
-
21
-
22
-
23
-
24
-
25
-
26
-
27
-
28
-
29
-
30
-
31
-
32
-
33
-
34
-
35
-
36
-
37
-
38
-
39
-
40
-
41
-
42
-
43
-
44
-
45
-
46
-
47
-
48
-
49
-
50
-
51
-
52
-
53
-
54
-
55
-
56
-
57
-
58
-
59
-
60
-
61
-
62
-
63
-
 64
64 -
 65
65 -
 66
66 -
 67
67 -
 68
68 -
 69
69 -
 70
70 -
 71
71 -
 72
72 -
 73
73 -
 74
74 -
 75
75 -
 76
76 -
 77
77 -
 78
78 -
 79
79 -
 80
80 -
 81
81 -
 82
82 -
 83
83 -
 84
84 -
85
-
86
-
87
-
88
-
89
-
90
-
91
-
92
-
93
-
94
-
95
-
96
-
97
-
98
-
99
-
100
-
101
-
102
-
103
-
104
-
105
-
106
-
107
-
108
-
109
-
110
-
111
-
112
-
113
-
114
-
115
-
116
-
117
-
118
-
119
-
120
-
121
-
122
-
123
-
124
-
125
-
126
-
127
-
128
-
129
-
130
-
131
-
132
-
133
-
134
-
135
-
136
-
137
-
138
-
139
-
140
-
141
-
142
-
143
-
144
-
145
-
146
-
147
-
148
-
149
-
150
-
151
-
152
-
153
-
154
-
155
-
156
-
157
-
158
-
159
-
160
-
161
-
162
-
163
-
164
-
165
-
166
-
167
-
168
-
169
-
170
-
171
-
172
-
173
-
174
-
175
-
176
-
177
-
178
-
179
-
180
-
181
-
182
-
183
-
184
-
185
-
186
-
187
-
188
-
189
-
190
-
191
-
192
-
193
-
194
-
195
-
196
-
197
-
198
-
199
-
200
-
201
-
202
-
203
-
204
-
205
-
206
-
207
-
208
-
209
-
210
-
211
-
212
-
213
-
214
-
215
-
216
-
217
-
218
-
219
-
220
-
221
-
222
-
223
-
224
-
225
-
226
-
227
-
228
-
229
-
230
-
231
-
232
-
233
-
234
-
235
-
236
-
237
-
238
-
239
-
240
-
241
-
242
-
243
-
244
-
245
-
246
-
247
-
248
-
249
-
250
-
251
-
252
-
253
-
254
-
255
-
256
-
257
-
258
-
259
-
260
-
261
-
262
-
263
-
264
-
265
-
266
-
267
-
268
-
269
-
270
-
271
-
272
-
273
-
274
-
275
-
276
-
277
-
278
-
279
-
280
-
281
-
282
-
283
-
284
-
285
 |
 |

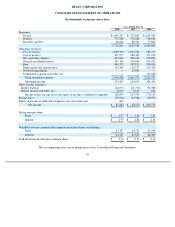
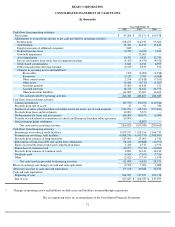
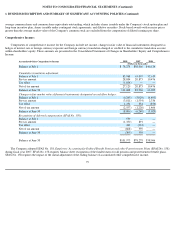
REGIS CORPORATION
CONSOLIDATED STATEMENT OF CASH FLOWS
(In thousands)
*
Years Ended June 30,
2008
2007
2006
Cash flows from operating activities:
Net income
$
85,204
$
83,170
$
109,578
Adjustments to reconcile net income to net cash provided by operating activities:
Depreciation
108,673
104,915
95,660
Amortization
11,304
12,412
11,810
Equity in income of affiliated companies
(849
)
—
—
Deferred income taxes
(3,789
)
(6,243
)
7,409
Goodwill impairment
—
23,000
—
Asset impairment
10,471
6,813
12,740
Excess tax benefits from stock
-
based compensation plans
(1,420
)
(4,536
)
(4,556
)
Stock
-
based compensation
6,841
4,911
4,905
Other noncash items affecting earnings
(2,015
)
2,831
316
Changes in operating assets and liabilities*:
Receivables
(709
)
(4,092
)
(4,918
)
Inventories
(5,232
)
2,709
(6,068
)
Other current assets
2,554
(15,818
)
(7,551
)
Other assets
16,184
(9,715
)
(1,027
)
Accounts payable
(9,480
)
11,814
151
Accrued expenses
18,729
14,622
46,773
Other noncurrent liabilities
(14,083
)
15,067
16,463
Net cash provided by operating activities
222,383
241,860
281,685
Cash flows from investing activities:
Capital expenditures
(85,799
)
(90,079
)
(119,914
)
Proceeds from sale of assets
47
97
730
Purchases of salon, school and hair restoration center net assets, net of cash acquired
(132,971
)
(68,747
)
(155,481
)
Proceeds from loans and investments
10,000
5,250
—
Disbursements for loans and investments
(46,400
)
(30,673
)
(6,000
)
Transfer of cash related to contribtion of schools and European franchise salon operations
(10,906
)
—
—
Net investment hedge settlement
—
(
8,897
)
—
Net cash used in investing activities
(266,029
)
(193,049
)
(280,665
)
Cash flows from financing activities:
Borrowings on revolving credit facilities
9,079,917
7,028,556
3,054,730
Payments on revolving credit facilities
(9,088,530
)
(6,943,750
)
(2,998,480
)
Proceeds from issuance of long
-
term debt
125,000
25,000
1,766
Repayments of long
-
term debt and capital lease obligations
(78,161
)
(40,888
)
(22,553
)
Excess tax benefits from stock
-
based compensation plans
1,420
4,536
4,556
Repurchase of common stock
(49,957
)
(79,710
)
(20,280
)
Proceeds from issuance of common stock
8,893
14,310
14,410
Dividends paid
(6,964
)
(7,169
)
(7,256
)
Other
(2,622
)
(7,310
)
1,678
Net cash (used in) provided by financing activities
(11,004
)
(6,425
)
28,571
Effect of exchange rate changes on cash and cash equivalents
(2,508
)
7,002
3,088
(Decrease) increase in cash and cash equivalents
(57,158
)
49,388
32,679
Cash and cash equivalents:
Beginning of year
184,785
135,397
102,718
End of year
127,627
$
184,785
$
135,397
Changes in operating assets and liabilities exclude assets and liabilities assumed through acquisitions
The accompanying notes are an integral part of the Consolidated Financial Statements.
72