Supercuts 2008 Annual Report Download - page 72
Download and view the complete annual report
Please find page 72 of the 2008 Supercuts annual report below. You can navigate through the pages in the report by either clicking on the pages listed below, or by using the keyword search tool below to find specific information within the annual report.-
 1
1 -
2
-
3
-
4
-
5
-
6
-
7
-
8
-
9
-
10
-
11
-
12
-
13
-
14
-
15
-
16
-
17
-
18
-
19
-
20
-
21
-
22
-
23
-
24
-
25
-
26
-
27
-
28
-
29
-
30
-
31
-
32
-
33
-
34
-
35
-
36
-
37
-
38
-
39
-
40
-
41
-
42
-
43
-
44
-
45
-
46
-
47
-
48
-
49
-
50
-
51
-
52
-
53
-
54
-
55
-
56
-
57
-
58
-
59
-
60
-
61
-
 62
62 -
 63
63 -
 64
64 -
 65
65 -
 66
66 -
 67
67 -
 68
68 -
 69
69 -
 70
70 -
 71
71 -
 72
72 -
 73
73 -
 74
74 -
 75
75 -
 76
76 -
 77
77 -
 78
78 -
 79
79 -
 80
80 -
 81
81 -
 82
82 -
83
-
84
-
85
-
86
-
87
-
88
-
89
-
90
-
91
-
92
-
93
-
94
-
95
-
96
-
97
-
98
-
99
-
100
-
101
-
102
-
103
-
104
-
105
-
106
-
107
-
108
-
109
-
110
-
111
-
112
-
113
-
114
-
115
-
116
-
117
-
118
-
119
-
120
-
121
-
122
-
123
-
124
-
125
-
126
-
127
-
128
-
129
-
130
-
131
-
132
-
133
-
134
-
135
-
136
-
137
-
138
-
139
-
140
-
141
-
142
-
143
-
144
-
145
-
146
-
147
-
148
-
149
-
150
-
151
-
152
-
153
-
154
-
155
-
156
-
157
-
158
-
159
-
160
-
161
-
162
-
163
-
164
-
165
-
166
-
167
-
168
-
169
-
170
-
171
-
172
-
173
-
174
-
175
-
176
-
177
-
178
-
179
-
180
-
181
-
182
-
183
-
184
-
185
-
186
-
187
-
188
-
189
-
190
-
191
-
192
-
193
-
194
-
195
-
196
-
197
-
198
-
199
-
200
-
201
-
202
-
203
-
204
-
205
-
206
-
207
-
208
-
209
-
210
-
211
-
212
-
213
-
214
-
215
-
216
-
217
-
218
-
219
-
220
-
221
-
222
-
223
-
224
-
225
-
226
-
227
-
228
-
229
-
230
-
231
-
232
-
233
-
234
-
235
-
236
-
237
-
238
-
239
-
240
-
241
-
242
-
243
-
244
-
245
-
246
-
247
-
248
-
249
-
250
-
251
-
252
-
253
-
254
-
255
-
256
-
257
-
258
-
259
-
260
-
261
-
262
-
263
-
264
-
265
-
266
-
267
-
268
-
269
-
270
-
271
-
272
-
273
-
274
-
275
-
276
-
277
-
278
-
279
-
280
-
281
-
282
-
283
-
284
-
285
 |
 |

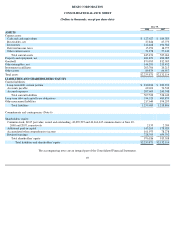
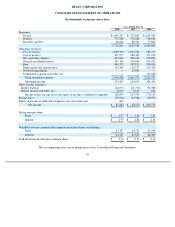
REGIS CORPORATION
CONSOLIDATED STATEMENT OF OPERATIONS
(In thousands, except per share data)
The accompanying notes are an integral part of the Consolidated Financial Statements.
70
Years Ended June 30,
2008
2007
2006
Revenues:
Service
$
1,894,257
$
1,793,802
$
1,634,028
Product
775,980
752,280
718,942
Royalties and fees
68,628
80,506
77,894
2,738,865
2,626,588
2,430,864
Operating expenses:
Cost of service
1,090,710
1,014,781
928,515
Cost of product
395,979
380,492
371,018
Site operating expenses
204,001
208,101
199,602
General and administrative
337,160
328,644
294,092
Rent
406,270
382,820
350,926
Depreciation and amortization
130,448
124,137
115,903
Goodwill impairment
—
23,000
—
Terminated acquisition income, net
—
—
(
33,683
)
Total operating expenses
2,564,568
2,461,975
2,226,373
Operating income
174,297
164,613
204,491
Other income (expense):
Interest expense
(44,571
)
(41,770
)
(34,989
)
Interest income and other, net
8,373
5,113
651
Income before income taxes and equity in income of affiliated companies
138,099
127,956
170,153
Income taxes
(53,744
)
(44,786
)
(60,575
)
Equity in income of affiliated companies, net of income taxes
849
—
—
Net income
$
85,204
$
83,170
$
109,578
Net income per share:
Basic
$
1.97
$
1.86
$
2.43
Diluted
$
1.95
$
1.82
$
2.36
Weighted average common and common equivalent shares outstanding:
Basic
43,157
44,723
45,168
Diluted
43,587
45,623
46,400
Cash dividends declared per common share
$
0.16
$
0.16
$
0.16