Supercuts 2008 Annual Report Download - page 115
Download and view the complete annual report
Please find page 115 of the 2008 Supercuts annual report below. You can navigate through the pages in the report by either clicking on the pages listed below, or by using the keyword search tool below to find specific information within the annual report.-
 1
1 -
2
-
3
-
4
-
5
-
6
-
7
-
8
-
9
-
10
-
11
-
12
-
13
-
14
-
15
-
16
-
17
-
18
-
19
-
20
-
21
-
22
-
23
-
24
-
25
-
26
-
27
-
28
-
29
-
30
-
31
-
32
-
33
-
34
-
35
-
36
-
37
-
38
-
39
-
40
-
41
-
42
-
43
-
44
-
45
-
46
-
47
-
48
-
49
-
50
-
51
-
52
-
53
-
54
-
55
-
56
-
57
-
58
-
59
-
60
-
61
-
62
-
63
-
64
-
65
-
66
-
67
-
68
-
69
-
70
-
71
-
72
-
73
-
74
-
75
-
76
-
77
-
78
-
79
-
80
-
81
-
82
-
83
-
84
-
85
-
86
-
87
-
88
-
89
-
90
-
91
-
92
-
93
-
94
-
95
-
96
-
97
-
98
-
99
-
100
-
101
-
102
-
103
-
104
-
 105
105 -
 106
106 -
 107
107 -
 108
108 -
 109
109 -
 110
110 -
 111
111 -
 112
112 -
 113
113 -
 114
114 -
 115
115 -
 116
116 -
 117
117 -
 118
118 -
 119
119 -
 120
120 -
 121
121 -
 122
122 -
 123
123 -
 124
124 -
 125
125 -
126
-
127
-
128
-
129
-
130
-
131
-
132
-
133
-
134
-
135
-
136
-
137
-
138
-
139
-
140
-
141
-
142
-
143
-
144
-
145
-
146
-
147
-
148
-
149
-
150
-
151
-
152
-
153
-
154
-
155
-
156
-
157
-
158
-
159
-
160
-
161
-
162
-
163
-
164
-
165
-
166
-
167
-
168
-
169
-
170
-
171
-
172
-
173
-
174
-
175
-
176
-
177
-
178
-
179
-
180
-
181
-
182
-
183
-
184
-
185
-
186
-
187
-
188
-
189
-
190
-
191
-
192
-
193
-
194
-
195
-
196
-
197
-
198
-
199
-
200
-
201
-
202
-
203
-
204
-
205
-
206
-
207
-
208
-
209
-
210
-
211
-
212
-
213
-
214
-
215
-
216
-
217
-
218
-
219
-
220
-
221
-
222
-
223
-
224
-
225
-
226
-
227
-
228
-
229
-
230
-
231
-
232
-
233
-
234
-
235
-
236
-
237
-
238
-
239
-
240
-
241
-
242
-
243
-
244
-
245
-
246
-
247
-
248
-
249
-
250
-
251
-
252
-
253
-
254
-
255
-
256
-
257
-
258
-
259
-
260
-
261
-
262
-
263
-
264
-
265
-
266
-
267
-
268
-
269
-
270
-
271
-
272
-
273
-
274
-
275
-
276
-
277
-
278
-
279
-
280
-
281
-
282
-
283
-
284
-
285
 |
 |

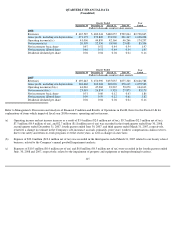
NOTES TO CONSOLIDATED FINANCIAL STATEMENTS (Continued)
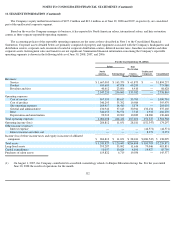
11. SEGMENT INFORMATION (Continued)
ended July 31, 2007 for the accredited cosmetology schools are reported in the North American salons segment. The Company retained
ownership of its one North American and four United Kingdom Sassoon schools. Subsequent to August 1, 2007 results of operations for
the Sassoon schools are included in their respective North American and international salon segments.
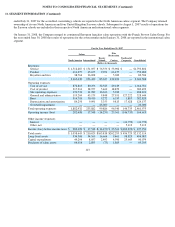
On January 31, 2008, the Company merged its continental European franchise salon operations with the Franck Provost Salon Group. For
the year ended June 30, 2008 the results of operations for the seven months ended January 31, 2008 are reported in the international salon
segment.
113
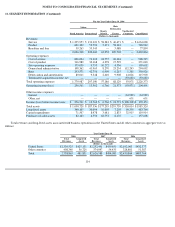
For the Year Ended June 30, 2007
Salons
Beauty
Schools
Hair
Restoration
Centers
Unallocated
Corporate
North America
International
Consolidated
(Dollars in thousands)
Revenues:
Service
$
1,512,287
$
151,057
$
76,556
$
53,902
$
—
$
1,793,802
Product
614,377
65,675
9,071
63,157
—
752,280
Royalties and fees
38,766
36,698
—
5,042
—
80,506
2,165,430
253,430
85,627
122,101
—
2,626,588
Operating expenses:
Cost of service
872,813
80,256
32,583
29,129
—
1,014,781
Cost of product
317,214
38,957
5,462
18,859
—
380,492
Site operating expenses
174,733
11,989
16,366
5,013
—
208,101
General and administrative
119,204
45,179
9,848
27,191
127,222
328,644
Rent
314,718
50,410
9,272
6,535
1,885
382,820
Depreciation and amortization
84,250
9,091
3,355
9,813
17,628
124,137
Goodwill impairment
—
—
23,000
—
—
23,000
Total operating expenses
1,882,932
235,882
99,886
96,540
146,735
2,461,975
Operating income (loss)
282,498
17,548
(14,259
)
25,561
(146,735
)
164,613
Other income (expense):
Interest
—
—
—
—
(
41,770
)
(41,770
)
Other, net
—
—
—
—
5,113
5,113
Income (loss) before income taxes
$
282,498
$
17,548
$
(14,259
)
$
25,561
$
(183,392
)
$
127,956
Total assets
$
1,058,643
$
210,629
$
163,818
$
262,295
$
436,729
$
2,132,114
Long
-
lived assets
334,568
34,569
16,664
9,461
98,823
494,085
Capital expenditures
49,294
8,057
2,493
4,590
25,645
90,079
Purchases of salon assets
64,614
2,895
(73
)
1,869
—
69,305