Supercuts 2008 Annual Report Download - page 40
Download and view the complete annual report
Please find page 40 of the 2008 Supercuts annual report below. You can navigate through the pages in the report by either clicking on the pages listed below, or by using the keyword search tool below to find specific information within the annual report.-
 1
1 -
2
-
3
-
4
-
5
-
6
-
7
-
8
-
9
-
10
-
11
-
12
-
13
-
14
-
15
-
16
-
17
-
18
-
19
-
20
-
21
-
22
-
23
-
24
-
25
-
26
-
27
-
28
-
29
-
 30
30 -
 31
31 -
 32
32 -
 33
33 -
 34
34 -
 35
35 -
 36
36 -
 37
37 -
 38
38 -
 39
39 -
 40
40 -
 41
41 -
 42
42 -
 43
43 -
 44
44 -
 45
45 -
 46
46 -
 47
47 -
 48
48 -
 49
49 -
 50
50 -
51
-
52
-
53
-
54
-
55
-
56
-
57
-
58
-
59
-
60
-
61
-
62
-
63
-
64
-
65
-
66
-
67
-
68
-
69
-
70
-
71
-
72
-
73
-
74
-
75
-
76
-
77
-
78
-
79
-
80
-
81
-
82
-
83
-
84
-
85
-
86
-
87
-
88
-
89
-
90
-
91
-
92
-
93
-
94
-
95
-
96
-
97
-
98
-
99
-
100
-
101
-
102
-
103
-
104
-
105
-
106
-
107
-
108
-
109
-
110
-
111
-
112
-
113
-
114
-
115
-
116
-
117
-
118
-
119
-
120
-
121
-
122
-
123
-
124
-
125
-
126
-
127
-
128
-
129
-
130
-
131
-
132
-
133
-
134
-
135
-
136
-
137
-
138
-
139
-
140
-
141
-
142
-
143
-
144
-
145
-
146
-
147
-
148
-
149
-
150
-
151
-
152
-
153
-
154
-
155
-
156
-
157
-
158
-
159
-
160
-
161
-
162
-
163
-
164
-
165
-
166
-
167
-
168
-
169
-
170
-
171
-
172
-
173
-
174
-
175
-
176
-
177
-
178
-
179
-
180
-
181
-
182
-
183
-
184
-
185
-
186
-
187
-
188
-
189
-
190
-
191
-
192
-
193
-
194
-
195
-
196
-
197
-
198
-
199
-
200
-
201
-
202
-
203
-
204
-
205
-
206
-
207
-
208
-
209
-
210
-
211
-
212
-
213
-
214
-
215
-
216
-
217
-
218
-
219
-
220
-
221
-
222
-
223
-
224
-
225
-
226
-
227
-
228
-
229
-
230
-
231
-
232
-
233
-
234
-
235
-
236
-
237
-
238
-
239
-
240
-
241
-
242
-
243
-
244
-
245
-
246
-
247
-
248
-
249
-
250
-
251
-
252
-
253
-
254
-
255
-
256
-
257
-
258
-
259
-
260
-
261
-
262
-
263
-
264
-
265
-
266
-
267
-
268
-
269
-
270
-
271
-
272
-
273
-
274
-
275
-
276
-
277
-
278
-
279
-
280
-
281
-
282
-
283
-
284
-
285
 |
 |

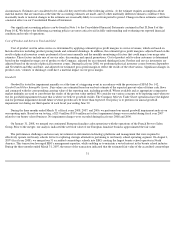
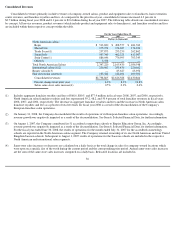
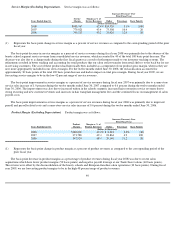
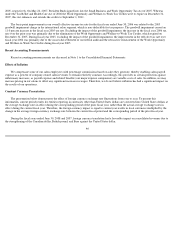
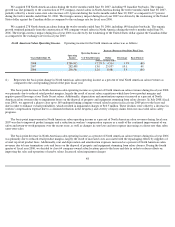
Consolidated revenues are primarily composed of service and product revenues, as well as franchise royalties and fees. Fluctuations in these
three major revenue categories were as follows:
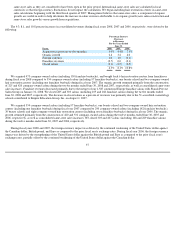
Service Revenues. Service revenues include revenues generated from company-owned salons and service revenues generated by hair
restoration centers. Consolidated service revenues were as follows:
The growth in service revenues during fiscal year 2008 was driven by acquisitions and new salon construction (a component of organic
growth). Service revenue growth was driven by a consolidated same-store service sales increase of 2.0 percent during the twelve months ended
June 30, 2008 as a result of price increases. Growth was negatively impacted as a result of the deconsolidation of our 51 accredited cosmetology
schools to Empire Education Group, Inc. on August 31, 2007.
The growth in service revenues during fiscal year 2007 was driven primarily by acquisitions and new salon construction (a component of
organic growth). Consolidated same-store service sales increased 1.0 percent during the twelve months ended June 30, 2007. Additionally, hair
restoration service revenues contributed to the increase in consolidated service revenues during the twelve months ended June 30, 2007 due to
strong recurring and new customer revenues and increases in hair transplant management fees. Same-
store sales were negatively impacted by the
sustained long-hair trend, as customer visitation patterns continued to be modest related to the fashion trend towards longer hairstyles.
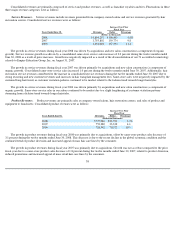
The growth in service revenues during fiscal year 2006 was driven primarily by acquisitions and new salon construction (a component of
organic growth). Same-store service sales in our salons continued to be modest due to a slight lengthening of customer visitation patterns
stemming from a fashion trend towards longer hairstyles.
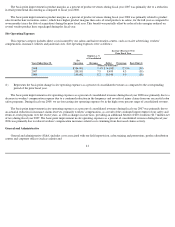
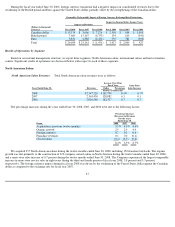
Product Revenues. Product revenues are primarily sales at company-owned salons, hair restoration centers, and sales of product and
equipment to franchisees. Consolidated product revenues were as follows:
The growth in product revenues during fiscal year 2008 was primarily due to acquisitions, offset by same-store product sales decrease of
3.1 percent during the twelve months ended June 30, 2008. This decrease is due to the recent decline in the global economic condition and the
continued trend of product diversion and increased appeal of mass hair care lines by the consumer.
The growth in product revenues during fiscal year 2007 was primarily due to acquisitions. Growth was not as robust compared to the prior
fiscal year due to a same-store product sales decrease of 1.8 percent during the twelve months ended June 30, 2007, related to product diversion,
reduced promotions and increased appeal of mass retail hair care lines by the consumer.
38
Increase Over Prior
Fiscal Year
Years Ended June 30,
Revenues
Dollar
Percentage
(Dollars in thousands)
2008
$
1,894,257
$
100,455
5.6
%
2007
1,793,802
159,774
9.8
2006
1,634,028
167,692
11.4
Increase Over Prior
Fiscal Year
Years Ended June 30,
Revenues
Dollar
Percentage
(Dollars in thousands)
2008
$
775,980
$
23,700
3.2
%
2007
752,280
33,338
4.6
2006
718,942
70,522
10.9