Supercuts 2008 Annual Report Download - page 111
Download and view the complete annual report
Please find page 111 of the 2008 Supercuts annual report below. You can navigate through the pages in the report by either clicking on the pages listed below, or by using the keyword search tool below to find specific information within the annual report.-
 1
1 -
2
-
3
-
4
-
5
-
6
-
7
-
8
-
9
-
10
-
11
-
12
-
13
-
14
-
15
-
16
-
17
-
18
-
19
-
20
-
21
-
22
-
23
-
24
-
25
-
26
-
27
-
28
-
29
-
30
-
31
-
32
-
33
-
34
-
35
-
36
-
37
-
38
-
39
-
40
-
41
-
42
-
43
-
44
-
45
-
46
-
47
-
48
-
49
-
50
-
51
-
52
-
53
-
54
-
55
-
56
-
57
-
58
-
59
-
60
-
61
-
62
-
63
-
64
-
65
-
66
-
67
-
68
-
69
-
70
-
71
-
72
-
73
-
74
-
75
-
76
-
77
-
78
-
79
-
80
-
81
-
82
-
83
-
84
-
85
-
86
-
87
-
88
-
89
-
90
-
91
-
92
-
93
-
94
-
95
-
96
-
97
-
98
-
99
-
100
-
 101
101 -
 102
102 -
 103
103 -
 104
104 -
 105
105 -
 106
106 -
 107
107 -
 108
108 -
 109
109 -
 110
110 -
 111
111 -
 112
112 -
 113
113 -
 114
114 -
 115
115 -
 116
116 -
 117
117 -
 118
118 -
 119
119 -
 120
120 -
 121
121 -
122
-
123
-
124
-
125
-
126
-
127
-
128
-
129
-
130
-
131
-
132
-
133
-
134
-
135
-
136
-
137
-
138
-
139
-
140
-
141
-
142
-
143
-
144
-
145
-
146
-
147
-
148
-
149
-
150
-
151
-
152
-
153
-
154
-
155
-
156
-
157
-
158
-
159
-
160
-
161
-
162
-
163
-
164
-
165
-
166
-
167
-
168
-
169
-
170
-
171
-
172
-
173
-
174
-
175
-
176
-
177
-
178
-
179
-
180
-
181
-
182
-
183
-
184
-
185
-
186
-
187
-
188
-
189
-
190
-
191
-
192
-
193
-
194
-
195
-
196
-
197
-
198
-
199
-
200
-
201
-
202
-
203
-
204
-
205
-
206
-
207
-
208
-
209
-
210
-
211
-
212
-
213
-
214
-
215
-
216
-
217
-
218
-
219
-
220
-
221
-
222
-
223
-
224
-
225
-
226
-
227
-
228
-
229
-
230
-
231
-
232
-
233
-
234
-
235
-
236
-
237
-
238
-
239
-
240
-
241
-
242
-
243
-
244
-
245
-
246
-
247
-
248
-
249
-
250
-
251
-
252
-
253
-
254
-
255
-
256
-
257
-
258
-
259
-
260
-
261
-
262
-
263
-
264
-
265
-
266
-
267
-
268
-
269
-
270
-
271
-
272
-
273
-
274
-
275
-
276
-
277
-
278
-
279
-
280
-
281
-
282
-
283
-
284
-
285
 |
 |

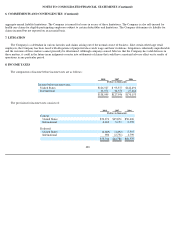
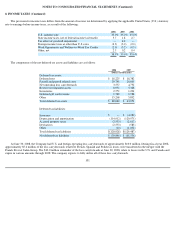
NOTES TO CONSOLIDATED FINANCIAL STATEMENTS (Continued)
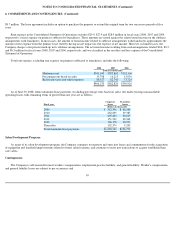
10. SHAREHOLDERS' EQUITY (Continued)
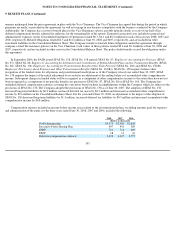
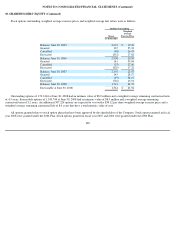
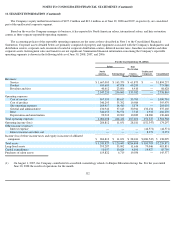
Grants of RSAs, RSUs and SARs outstanding under the 2004 Plan, as well as other relevant terms of the awards, were as follows:
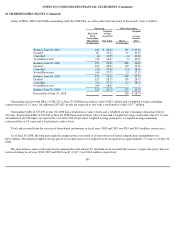
Outstanding and unvested RSAs of 308,325 at June 30, 2008 had an intrinsic value of $8.1 million and a weighted average remaining
contractual term of 2.3 years. An additional 293,802 awards are expected to vest with a total intrinsic value of $7.7 million.
Outstanding SARs of 527,300 at June 30, 2008 had a total intrinsic value of zero and a weighted average remaining contractual term of
6.8 years. Exercisable SARs of 181,820 at June 30, 2008 had a total intrinsic value of zero and a weighted average contractual term of 7.0 years.
An additional 332,306 rights are expected to vest with a $34.00 per share weighted average grant price, a weighted average remaining
contractual life of 6.7 years and a total intrinsic value of zero.
Total cash received from the exercise of share-based instruments in fiscal years 2008 and 2007 was $8.9 and $16.8 million, respectively.
As of June 30, 2008, the total unrecognized compensation cost related to all unvested stock-based compensation arrangements was
$23.9 million. The related weighted average period over which such cost is expected to be recognized was approximately 3.7 years as of June 30,
2008.
The total intrinsic value of all stock-based compensation (the amount by which the stock exceeded the exercise or grant date price) that was
exercised during fiscal years 2008, 2007 and 2006 was $7.3, $17.7 and $18.4 million, respectively.
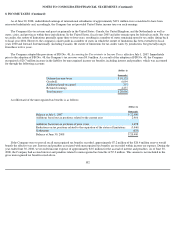
109
Nonvested SARs Outstanding
Restricted
Stock
Outstanding
Shares/Units
Weighted
Average
Grant Date
Fair Value
Shares
Weighted
Average
Exercise
Price
(in thousands)
(in thousands)
Balance, June 30, 2005
142
$
38.40
197
$
39.16
Granted
86
35.33
97
35.33
Cancelled
(3
)
39.59
(3
)
39.98
Vested/Exercised
(32
)
38.67
(5
)
40.31
Balance, June 30, 2006
193
36.92
286
36.87
Granted
343
40.07
139
39.01
Cancelled
(21
)
37.84
(23
)
38.41
Vested/Exercised
(41
)
37.33
(2
)
37.92
Balance, June 30, 2007
474
38.36
400
37.53
Granted
125
28.57
138
28.57
Cancelled
(10
)
37.71
(11
)
38.53
Vested/Exercised
(66
)
38.05
—
—
Balance, June 30, 2008
523
36.76
527
35.70
Exercisable at June 30, 2008
182
$
38.73