Supercuts 2008 Annual Report Download - page 52
Download and view the complete annual report
Please find page 52 of the 2008 Supercuts annual report below. You can navigate through the pages in the report by either clicking on the pages listed below, or by using the keyword search tool below to find specific information within the annual report.-
 1
1 -
2
-
3
-
4
-
5
-
6
-
7
-
8
-
9
-
10
-
11
-
12
-
13
-
14
-
15
-
16
-
17
-
18
-
19
-
20
-
21
-
22
-
23
-
24
-
25
-
26
-
27
-
28
-
29
-
30
-
31
-
32
-
33
-
34
-
35
-
36
-
37
-
38
-
39
-
40
-
41
-
 42
42 -
 43
43 -
 44
44 -
 45
45 -
 46
46 -
 47
47 -
 48
48 -
 49
49 -
 50
50 -
 51
51 -
 52
52 -
 53
53 -
 54
54 -
 55
55 -
 56
56 -
 57
57 -
 58
58 -
 59
59 -
 60
60 -
 61
61 -
 62
62 -
63
-
64
-
65
-
66
-
67
-
68
-
69
-
70
-
71
-
72
-
73
-
74
-
75
-
76
-
77
-
78
-
79
-
80
-
81
-
82
-
83
-
84
-
85
-
86
-
87
-
88
-
89
-
90
-
91
-
92
-
93
-
94
-
95
-
96
-
97
-
98
-
99
-
100
-
101
-
102
-
103
-
104
-
105
-
106
-
107
-
108
-
109
-
110
-
111
-
112
-
113
-
114
-
115
-
116
-
117
-
118
-
119
-
120
-
121
-
122
-
123
-
124
-
125
-
126
-
127
-
128
-
129
-
130
-
131
-
132
-
133
-
134
-
135
-
136
-
137
-
138
-
139
-
140
-
141
-
142
-
143
-
144
-
145
-
146
-
147
-
148
-
149
-
150
-
151
-
152
-
153
-
154
-
155
-
156
-
157
-
158
-
159
-
160
-
161
-
162
-
163
-
164
-
165
-
166
-
167
-
168
-
169
-
170
-
171
-
172
-
173
-
174
-
175
-
176
-
177
-
178
-
179
-
180
-
181
-
182
-
183
-
184
-
185
-
186
-
187
-
188
-
189
-
190
-
191
-
192
-
193
-
194
-
195
-
196
-
197
-
198
-
199
-
200
-
201
-
202
-
203
-
204
-
205
-
206
-
207
-
208
-
209
-
210
-
211
-
212
-
213
-
214
-
215
-
216
-
217
-
218
-
219
-
220
-
221
-
222
-
223
-
224
-
225
-
226
-
227
-
228
-
229
-
230
-
231
-
232
-
233
-
234
-
235
-
236
-
237
-
238
-
239
-
240
-
241
-
242
-
243
-
244
-
245
-
246
-
247
-
248
-
249
-
250
-
251
-
252
-
253
-
254
-
255
-
256
-
257
-
258
-
259
-
260
-
261
-
262
-
263
-
264
-
265
-
266
-
267
-
268
-
269
-
270
-
271
-
272
-
273
-
274
-
275
-
276
-
277
-
278
-
279
-
280
-
281
-
282
-
283
-
284
-
285
 |
 |

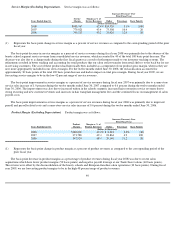
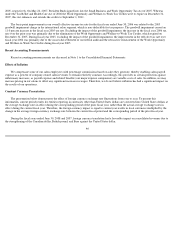
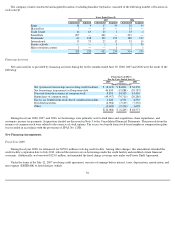
British pound and the Euro as compared to the exchange rates for fiscal year 2005. The decrease in franchise revenues was primarily due to the
closure and sale of 116 franchise salons during fiscal year 2006.
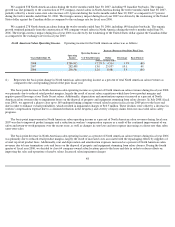
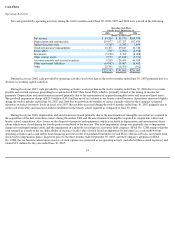
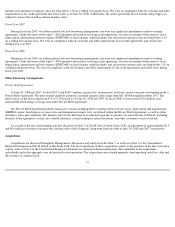
International Salon Operating Income. Operating income for the international salons was as follows:
(1)
Increase (Decrease) Over Prior Fiscal Year
Years Ended June 30,
Operating
Income
Operating Income
as % of
Total Revenues
Dollar
Percentage
Basis Point(1)
(Dollars in thousands)
2008
$
11,651
4.6
%
$
(5,897
)
(33.6
)%
(230
)
2007
17,548
6.9
3,986
29.4
80
2006
13,562
6.1
31,695
174.8
1,410
Represents the basis point change in international salon operating income (loss) as a percent of total international salon revenues as
compared to the corresponding period of the prior fiscal year.
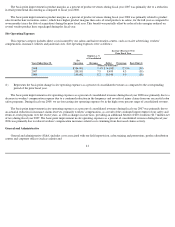
The basis point decrease in international salon operating income as a percent of international salon revenues during fiscal year 2008 was
primarily due to the deconsolidation of our European franchise salon operations, negative same-store sales, and higher impairment charges of
$1.1 million related to the Company approved plan to close underperforming company-owned salon locations in fiscal year 2009. These
decreases were offset by the inclusion of the Sassoon schools in the segment.
The basis point improvement in international salon operating income as a percent of international salon revenues during fiscal year 2007
was primarily due to improved product margins and severance expenses incurred in fiscal 2006 that did not occur in fiscal 2007. A same-store
product sales increase of 7.1 percent for the twelve months ended June 30, 2007 also contributed to the improvement.
The basis point improvement in international salon operating income as a percent of international salon revenues during fiscal year 2006
was primarily due to the goodwill impairment charge of $38.3 million recorded during the three months ended March 31, 2005, offset by a
$1.0 million charge in fiscal year 2006 related to the impairment of certain salons' property and equipment which contributed to an increase in
depreciation and amortization expense. Exclusive of the prior year goodwill impairment charge, operating income decreased 280 basis points as
a percentage of total international salon revenues. This decrease was primarily due to the impact of certain fixed cost categories, such as rent and
depreciation expense, measured as a percentage of lower same-store sales, as well as the $1.0 million of property and equipment impairment
charges.
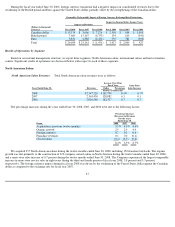
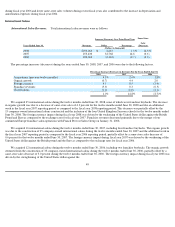
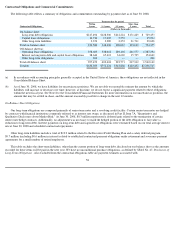
Hair Restoration Centers
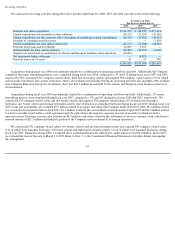
Hair Restoration Center Revenues. Total hair restoration center revenues were as follows:
(1)
Increase Over Prior
Fiscal Year
Same-
Store
Sales
Increase
Years Ended June 30, Revenues Dollar
Percentage
(Dollars in thousands)
2008
$
135,582
$
13,481
11.0
%
5.2
%
2007
122,101
12,399
11.3
8.7
2006(1)
109,702
50,314
84.7
N/A
We did not own or operate any hair restoration centers until December 2004.
50