Square Enix 2011 Annual Report Download - page 65
Download and view the complete annual report
Please find page 65 of the 2011 Square Enix annual report below. You can navigate through the pages in the report by either clicking on the pages listed below, or by using the keyword search tool below to find specific information within the annual report.-
 1
1 -
2
-
3
-
4
-
5
-
6
-
7
-
8
-
9
-
10
-
11
-
12
-
13
-
14
-
15
-
16
-
17
-
18
-
19
-
20
-
21
-
22
-
23
-
24
-
25
-
26
-
27
-
28
-
29
-
30
-
31
-
32
-
33
-
34
-
35
-
36
-
37
-
38
-
39
-
40
-
41
-
42
-
43
-
44
-
45
-
46
-
47
-
48
-
49
-
50
-
51
-
52
-
53
-
54
-
 55
55 -
 56
56 -
 57
57 -
 58
58 -
 59
59 -
 60
60 -
 61
61 -
 62
62 -
 63
63 -
 64
64 -
 65
65 -
 66
66 -
 67
67 -
 68
68 -
 69
69 -
 70
70 -
 71
71 -
 72
72
 |
 |

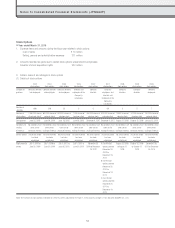
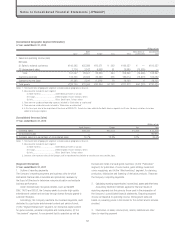
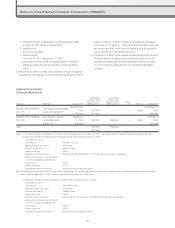
■ Year ended March 31, 2010 (for comparative purposes)
Millions of yen
Reporting Segments Adjustment
(Note 1)
Consolidated total
(Note 2)
Digital
Entertainment Amusement Publication Merchandising Total
Net sales
(1) Sales to outside customers ¥120,119 52,299 ¥14,367 ¥5,470 ¥192,257 ¥ — ¥192,257
(2) Intersegment sales 1 — — 2 3 (3) —
Total ¥120,120 ¥52,299 ¥14,367 ¥5,473 ¥192,261 ¥ (3) ¥192,257
Segment operating income ¥ 29,056 ¥ 3,986 ¥ 4,120 ¥1,827 ¥ 38,990 ¥(10,755) ¥ 28,235
Segment assets ¥ 56,581 ¥26,638 ¥ 6,574 ¥3,161 ¥ 92,955 ¥177,574 ¥270,529
Other items
Depreciation and amortization 2,383 4,828 14 15 7,241 721 7,962
Increases in property and equipment and
intangible assets 958 5,476 6 1 6,443 473 6,916
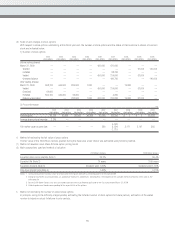
Notes: 1. (1) Segment adjustments (¥10,755 million) include amortization of goodwill (¥1,742 million) and unallocated corporate operating expenses (¥9,080 million).
(2) Unallocated assets amounting to ¥178,420 million are included in the ¥177,574 million adjustment to segment assets. Most of this amount comprises funds for
management of surplus funds (cash and cash equivalents).
(3) The ¥721 million adjustment to depreciation and amortization is associated with unallocated assets that do not belong to any reporting segment.
(4) The ¥473 million adjustment to increases in property and equipment and intangible assets is associated with unallocated assets that do not belong to any reporting
segment.
2. Segment operating income corresponds to operating income on the Consolidated Statements of Income.
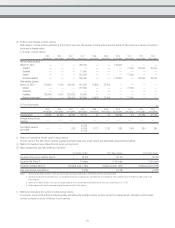
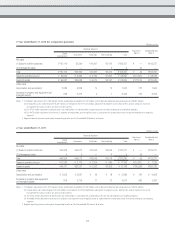
■ Year ended March 31, 2011
Millions of yen
Reporting Segments Adjustment
(Note 1)
Consolidated total
(Note 2)
Digital
Entertainment Amusement Publication Merchandising Total
Net sales
(1) Sales to outside customers ¥64,203 ¥45,012 ¥13,045 ¥3,009 ¥125,271 ¥ — ¥125,271
(2) Intersegment sales 0 0 — 8 9 (9) —
Total ¥64,204 ¥45,012 ¥13,045 ¥3,018 ¥125,280 ¥ (9) ¥125,271
Segment operating income ¥11,283 ¥ 2,178 ¥ 3,204 ¥ 680 ¥ 17,346 ¥(10,021) ¥ 7,325
Segment assets ¥44,471 ¥23,241 ¥ 5,252 ¥2,803 ¥ 75,768 ¥130,568 ¥206,336
Other items
Depreciation and amortization ¥ 1,855 ¥ 3,987 ¥ 22 ¥ 18 ¥ 5,884 ¥ 724 ¥ 6,608
Increases in property and equipment
and intangible assets 874 3,779 11 12 4,677 685 5,363
Notes: 1. (1) Segment adjustments (¥10,021 million) include amortization of goodwill (¥1,492 million) and unallocated corporate operating expenses (¥8,573 million).
(2) Unallocated assets amounting to ¥130,410 million are included in the ¥130,568 million adjustment to segment assets. Most of this amount comprises funds for
management of surplus funds (cash and cash equivalents).
(3) The ¥724 million adjustment to depreciation and amortization is associated with unallocated assets that do not belong to any reporting segment.
(4) The ¥685 million adjustment to increases in property and equipment and intangible assets is associated with unallocated assets that do not belong to any reporting
segment.
2. Segment operating income corresponds to operating income on the Consolidated Statements of Income.
63