Square Enix 2011 Annual Report Download - page 45
Download and view the complete annual report
Please find page 45 of the 2011 Square Enix annual report below. You can navigate through the pages in the report by either clicking on the pages listed below, or by using the keyword search tool below to find specific information within the annual report.-
 1
1 -
2
-
3
-
4
-
5
-
6
-
7
-
8
-
9
-
10
-
11
-
12
-
13
-
14
-
15
-
16
-
17
-
18
-
19
-
20
-
21
-
22
-
23
-
24
-
25
-
26
-
27
-
28
-
29
-
30
-
31
-
32
-
33
-
34
-
 35
35 -
 36
36 -
 37
37 -
 38
38 -
 39
39 -
 40
40 -
 41
41 -
 42
42 -
 43
43 -
 44
44 -
 45
45 -
 46
46 -
 47
47 -
 48
48 -
 49
49 -
 50
50 -
 51
51 -
 52
52 -
 53
53 -
 54
54 -
 55
55 -
56
-
57
-
58
-
59
-
60
-
61
-
62
-
63
-
64
-
65
-
66
-
67
-
68
-
69
-
70
-
71
-
72
 |
 |

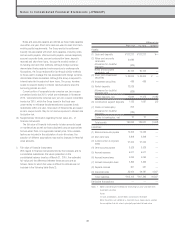
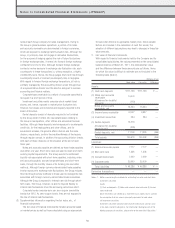
values were subsequently written down to the applicable recoverable
values. Note that calculation of recoverable amounts is based on net
selling price or value in use.
In principle, net selling price is based mainly on market price, and
value in use is calculated using future cash flows discounted at 10.5%.
*11 Loss related to content
These are losses related primarily to the special maintenance of
content.
*12 Loss on disposal of content and equipment
These are losses related to content in the Digital Entertainment
segment and equipment in the Amusement segment for which
development has ceased, following careful review of marketability
prompted by sluggish sales of newly released console games and
the market’s harsh assessment of key titles.
*13 Loss on disaster
This category includes restoration costs incurred in the repair or
rebuilding of arcade facilities damaged or destroyed by events
associated with the Tohoku Earthquake as well as fixed costs
incurred while facilities were closed.
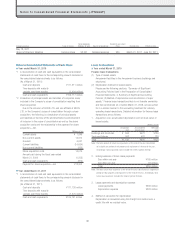
Notes to Consolidated Statement of Comprehensive
Income
■ Year ended March 31, 2011
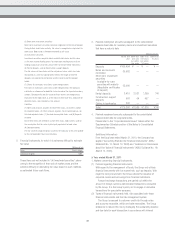
*1 Comprehensive income for the year ended March 31, 2010
Comprehensive income attributable to shareholders
of the Company ¥9,109 million
Comprehensive income attributable to
minority interests 27 million
Total ¥9,137 million
*2 Other comprehensive income (loss) for the year ended March 31,
2010
Unrealized gain on revaluation of other investment securities
¥62 million
Foreign currency translation adjustments (482) million
Total (420) million
Items Pertaining to the Consolidated Statements of
Changes in Net Assets
■ Year ended March 31, 2010
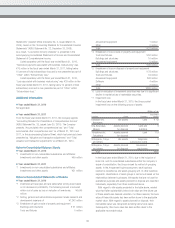
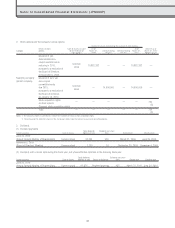
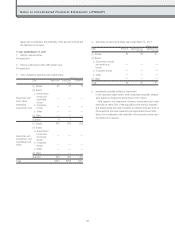
1. Type and number of shares issued and outstanding, and type and
number of shares of treasury stock
Thousands of shares
Shares as of Share Share Shares as of
March 31, increases decreases March 31,
2009 during the year during the year 2010
Shares issued and
outstanding
Common stock*1 115,305 64 — 115,370
Total 115,305 64 — 115,370
Treasury stock*2
Common stock 295 2 0 297
Total 295 2 0 297
*1 The increase of 64 thousand shares of common stock issued and outstanding was
due to the exercise of stock options.
*2 The increase of 2 thousand shares of treasury stock was due to the acquisition of
fractional shares constituting less than one trading unit.
The decrease of 0 thousand shares of treasury stock was due to the sale of
fractional shares constituting less than one trading unit
43